AMac (@amaccharts) 's Twitter Profile
AMac

@amaccharts

Crypto and stocks TA. Not financial advice, you’re responsible for your trades.

ID: 342243101

calendar_today25-07-2011 18:10:50

5,5K Tweet

2,2K Followers

428 Following

AMac (@amaccharts) 's Twitter Profile Photo

Just wanted to sort of show how different timeframes and potential actionable patterns and the amount of time a pattern supposedly will take to play out over time after seeing it

Just wanted to sort of show how different timeframes and potential actionable patterns and the amount of time a pattern supposedly will take to play out over time after seeing it
AMac (@amaccharts) 's Twitter Profile Photo

Check quoted post first but as you can see when we hit 99.9% of the time its lower, sure enough it has come down slightly. Again RSI can float up at these levels. But it helps to observe these statistics on multiple timeframes to get relative perspective on how much time RSI

Check quoted post first but as you can see when we hit 99.9% of the time its lower, sure enough it has come down slightly. Again RSI can float up at these levels. But it helps to observe these statistics on multiple timeframes to get relative perspective on how much time RSI
AMac (@amaccharts) 's Twitter Profile Photo

Tech-travel I did get a sell signal on the 3 hour timeframe but not the 6 hour timeframe. On 6 hour RSI is almost testing its WMA where we sometimes find support. You enjoy your weekend as well!
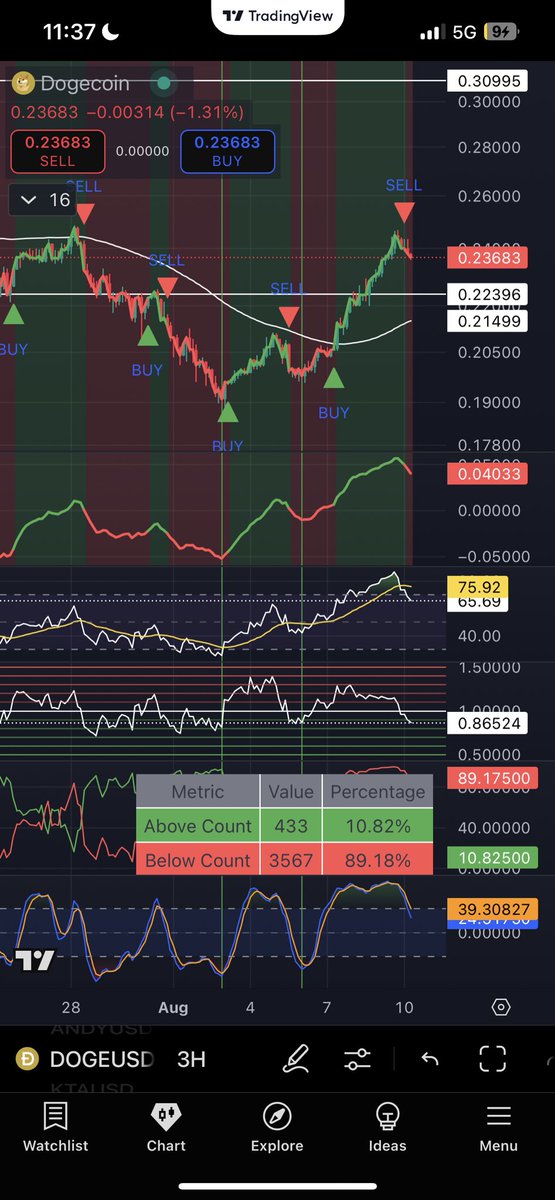
<a href="/TaroNarman123/">Tech-travel</a> I did get a sell signal on the 3 hour timeframe but not the 6 hour timeframe. On 6 hour RSI is almost testing its WMA where we sometimes find support. You enjoy your weekend as well!
AMac (@amaccharts) 's Twitter Profile Photo

Ok now that we got our correction (check quoted post).RSI/WMA is getting very low which when it spikes this low usually we get a pop upwards once it bottoms out

Ok now that we got our correction (check quoted post).RSI/WMA is getting very low which when it spikes this low usually we get a pop upwards once it bottoms out
AMac (@amaccharts) 's Twitter Profile Photo

$APP update. Check quoted post first APP was $376. We got a rally as expected. So in the very short term be careful chasing. With that said APP is looking good medium term as well. We did get a 5 day buy signal.

$APP update. Check quoted post first APP was $376. We got a rally as expected. So in the very short term be careful chasing. With that said APP is looking good medium term as well. We did get a 5 day buy signal.