Devashree Madhugiri (@dev_subhash21) 's Twitter Profile
Devashree Madhugiri

@dev_subhash21

Data Analyst | Machine Learning | Technical Author and Consultant | Kaggle Grandmaster

ID: 1239570516442136578

linkhttps://devashreemadhugiri.com/ calendar_today16-03-2020 15:13:45

64 Tweet

31 Followers

45 Following

Devashree Madhugiri (@dev_subhash21) 's Twitter Profile Photo

Impress your audience with dynamic and engaging data visualizations using #ipyvizzu! Check out my latest article on Analytics Vidhya to learn how to use this powerful tool and take your data visualization skills to the next level. ๐Ÿ“Š๐Ÿ’ก#Datavisualization #Python #analytics

Reluctant Quant (@drmattcrowson) 's Twitter Profile Photo

RT Top 3 Ways to Import Data into R using Copy and Paste dlvr.it/SlXMt0 #Beginner #DataVisualization #Excel #Listicle #MachineLearning

RT Top 3 Ways to Import Data into R using Copy and Paste dlvr.it/SlXMt0 #Beginner #DataVisualization #Excel #Listicle #MachineLearning
Devashree Madhugiri (@dev_subhash21) 's Twitter Profile Photo

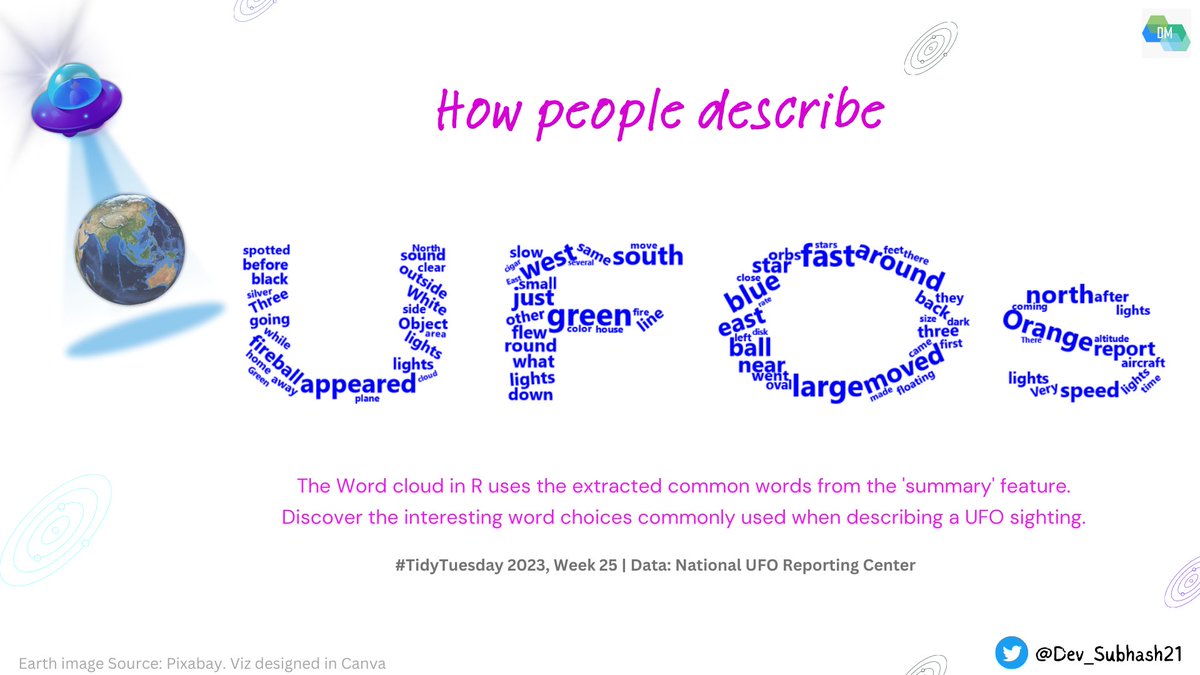
Here is my first submission for #TidyTuesday - a letter cloud showcasing the most common words people around the globe use when describing a UFO sighting.๐Ÿ›ธ๐ŸŒŒ #r4ds #tidyverse #dataviz #UFOsightings #rstats Code: github.com/Devashree21/Tiโ€ฆ

Here is my first submission for #TidyTuesday - a letter cloud showcasing the most common words people around the globe use when describing a UFO sighting.๐Ÿ›ธ๐ŸŒŒ #r4ds #tidyverse #dataviz #UFOsightings #rstats 
Code: github.com/Devashree21/Tiโ€ฆ
Devashree Madhugiri (@dev_subhash21) 's Twitter Profile Photo

Here is my #TidyTuesday submission for W26. We're looking at the feature_name counts across the west and east coastlines of US.๐ŸŒŠ๐Ÿ–๏ธ Both coastlines seem to be densely populated from the color gradients. #r4ds #tidyverse #dataviz #rstats Code: github.com/Devashree21/Tiโ€ฆ

Here is my #TidyTuesday submission for W26. We're looking at the feature_name counts across the west and east coastlines of US.๐ŸŒŠ๐Ÿ–๏ธ Both coastlines seem to be densely populated from the color gradients.
 #r4ds #tidyverse #dataviz #rstats 
Code: github.com/Devashree21/Tiโ€ฆ
KDnuggets (@kdnuggets) 's Twitter Profile Photo

5 Python Packages For Geospatial Data Analysis This article discusses the importance of geospatial analysis and introduces five essential Python packages for effectively handling and visualizing valuable insights from geospatial data. kdnuggets.com/2023/08/5-pythโ€ฆ

5 Python Packages For Geospatial Data Analysis
This article discusses the importance of geospatial analysis and introduces five essential Python packages for effectively handling and visualizing valuable insights from geospatial data.
kdnuggets.com/2023/08/5-pythโ€ฆ
Devashree Madhugiri (@dev_subhash21) 's Twitter Profile Photo

Elevate your #dataviz skills in R! Master #ggplot2 core components, charts, layering, aesthetics, and annotations to craft eye-catching visuals effortlessly for any #DataScience project. ๐Ÿ”—Link: educat.tv/3SwaTeg #๐„๐๐ฎ๐œ๐š๐ญ๐ข๐ฏ๐ž๐‚๐๐‚๐€ #rstats #DataAnalytics

Elevate your #dataviz  skills in R! Master #ggplot2 core components, charts, layering, aesthetics, and annotations to craft eye-catching visuals effortlessly for any #DataScience project.  
๐Ÿ”—Link: educat.tv/3SwaTeg

#๐„๐๐ฎ๐œ๐š๐ญ๐ข๐ฏ๐ž๐‚๐๐‚๐€ #rstats #DataAnalytics
Devashree Madhugiri (@dev_subhash21) 's Twitter Profile Photo

๐Ÿ“Š Master complex data visualizations in #ggplot2 using my new course "Data Visualizations with ggplot2 in R". ๐Ÿ”—Link: educat.tv/3SwaTeg ๐Ÿš€Here's what you'll master in the course: #๐„๐๐ฎ๐œ๐š๐ญ๐ข๐ฏ๐ž๐‚๐๐‚๐€ #datavisualization #DataAnalytics #rstats #datascience

๐Ÿ“Š Master complex data visualizations in #ggplot2 using my new course  "Data Visualizations with ggplot2 in R".

๐Ÿ”—Link: educat.tv/3SwaTeg

๐Ÿš€Here's what you'll master in the course:
#๐„๐๐ฎ๐œ๐š๐ญ๐ข๐ฏ๐ž๐‚๐๐‚๐€ #datavisualization #DataAnalytics  #rstats #datascience
Devashree Madhugiri (@dev_subhash21) 's Twitter Profile Photo

Test your knowledge of ๐Ÿ“Š#datavisualization. To learn more, check out my courseโฌ‡๏ธ. ๐Ÿ”—Link: educat.tv/3SwaTeg #๐„๐๐ฎ๐œ๐š๐ญ๐ข๐ฏ๐ž๐‚๐๐‚๐€ #DataAnalytics #rstats #datascience

Test your knowledge of ๐Ÿ“Š#datavisualization. 
To learn more, check out my courseโฌ‡๏ธ.

๐Ÿ”—Link: educat.tv/3SwaTeg

#๐„๐๐ฎ๐œ๐š๐ญ๐ข๐ฏ๐ž๐‚๐๐‚๐€ #DataAnalytics #rstats #datascience
Devashree Madhugiri (@dev_subhash21) 's Twitter Profile Photo

My course " Data Visualizations with #ggplot2 in R" covers from ๐Ÿ“ˆ basic charts to advanced interactive visualizations you need to level up your data skills!๐Ÿš€ ๐Ÿ”—Link: educat.tv/3SwaTeg #๐„๐๐ฎ๐œ๐š๐ญ๐ข๐ฏ๐ž๐‚๐๐‚๐€ #DataScience #rstats #Datavisualization #DataAnalytics

Devashree Madhugiri (@dev_subhash21) 's Twitter Profile Photo

5 reasons to take Data Visualizations with #ggplot2 in R 1. Powerful & Flexible Graphics 2. Enhanced Data Exploration 3. Publication-Quality Graphics 4. Consistent Syntax 5. Integration with Tidy Data Principles ๐Ÿ”—Link: educat.tv/3SwaTeg #๐„๐๐ฎ๐œ๐š๐ญ๐ข๐ฏ๐ž๐‚๐๐‚๐€

5 reasons to take Data Visualizations with #ggplot2 in R
1. Powerful & Flexible Graphics
2. Enhanced Data Exploration
3. Publication-Quality Graphics
4. Consistent Syntax
5. Integration with Tidy Data Principles
๐Ÿ”—Link: educat.tv/3SwaTeg
 #๐„๐๐ฎ๐œ๐š๐ญ๐ข๐ฏ๐ž๐‚๐๐‚๐€
Towards Data Science (@tdatascience) 's Twitter Profile Photo

"But what if you are an R user? Optuna is not directly available in R packages. Donโ€™t worry; we can still use Optuna in R." Don't miss Devashree Madhugiri's excellent new deep dive into hyperparameter tuning in R with the aid of the Reticulate package. towardsdatascience.com/how-to-performโ€ฆ

Towards Data Science (@tdatascience) 's Twitter Profile Photo

If you're an R user who's frustrated about not having Python tools for hyperparameter tuning at your disposal, Devashree Madhugiri presents a powerful workaround that relies on the Reticulate package. towardsdatascience.com/how-to-performโ€ฆ

Towards Data Science (@tdatascience) 's Twitter Profile Photo

Sentiment analysis in R helps businesses refine products, enhance strategies, and monitor reputation. Learn how packages like quanteda and sentimentr can transform feedback into growth from Devashree Madhugiri's new article. towardsdatascience.com/data-driven-deโ€ฆ

Towards Data Science (@tdatascience) 's Twitter Profile Photo

Want to understand your customers better? Sentiment analysis with R can reveal what they love (or donโ€™t) about your product. Devashree Madhugiri explores tools like quanteda, sentimentr, and textstem to turn feedback into actionable insights. towardsdatascience.com/data-driven-deโ€ฆ

Towards Data Science (@tdatascience) 's Twitter Profile Photo

Sentiment analysis gives businesses a clear idea about their customer needs and pain points. Devashree Madhugiri's article explores how R packages can help with sentiment analysis on customer feedback for a tech product. towardsdatascience.com/data-driven-deโ€ฆ