Shine Pulikathara (@vizshine) 's Twitter Profile
Shine Pulikathara

@vizshine

Visualization Manager @ Facebook exploring the connections between #business, #technology and #design. @tableau #IronViz Champion 2015. Views are my own.

ID: 167982035

calendar_today18-07-2010 02:14:38

2,2K Tweet

2,2K Followers

1,1K Following

Tableau (@tableau) 's Twitter Profile Photo

If you are a music fanatic, then Shine Pulikathara's analysis of Billboard's Hot 100 will be your new jam. 🎸🎵 Find your favorite hit in his off the charts viz: tabsoft.co/2IV4zeL

If you are a music fanatic, then <a href="/vizshine/">Shine Pulikathara</a>'s analysis of Billboard's Hot 100 will be your new jam. 🎸🎵 Find your favorite hit in his off the charts viz: tabsoft.co/2IV4zeL
Shine Pulikathara (@vizshine) 's Twitter Profile Photo

#TableauTip If you don't like the position of a mark label, just click it once and then drag it to the desired position. I find this especially useful for labeling marks in scatter plots.

Shine Pulikathara (@vizshine) 's Twitter Profile Photo

Maybe too soon to bring this up after Pi day but TIL why Tau(τ) might be superior to Pi(π) 🤯. What do you think? tauday.com/tau-manifesto

Shine Pulikathara (@vizshine) 's Twitter Profile Photo

My first Observable notebook (bit.ly/tabanime) is a 4-step guide to animating a Tableau Public #dataviz online. The example I chose to recreate is the Wealth and Health of Nations chart by the inspiring Remember H. Rosling. cc: Tableau

Tableau (@tableau) 's Twitter Profile Photo

Working on your #IronViz entry and struggling with blank canvas syndrome? Set your pace with examples of analysis, storytelling, and design: tabsoft.co/2HloSAp

Working on your #IronViz entry and struggling with blank canvas syndrome? Set your pace with examples of analysis, storytelling, and design: tabsoft.co/2HloSAp
Nadieh Bremer (@nadiehbremer) 's Twitter Profile Photo

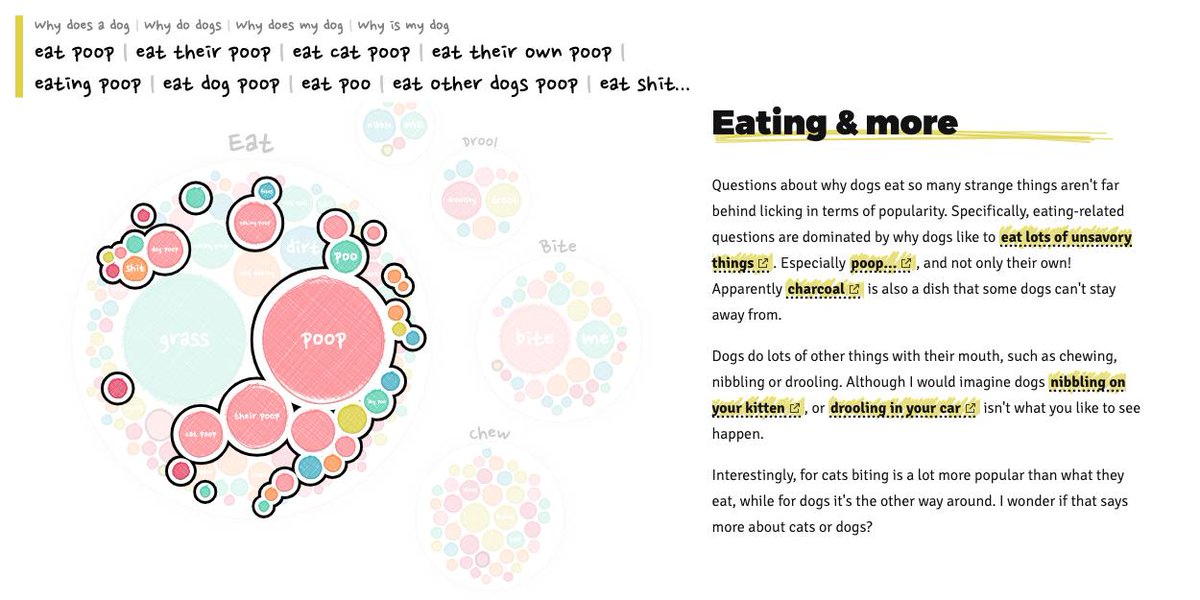
🎉 NEW!! 🎉 BIG release of my #dataviz-driven visual exploration in collaboration with Google Trends 😃 "Explore how people search on Google to understand the often weird & mysterious behavior of our 🐱 & 🐶!" whydocatsanddogs.com Enjoy exploring & Happy US Pet Day!

🎉 NEW!! 🎉 BIG release of my #dataviz-driven visual exploration in collaboration with Google Trends 😃

"Explore how people search on Google to understand the often weird &amp; mysterious behavior of our 🐱 &amp; 🐶!"

whydocatsanddogs.com
Enjoy exploring &amp; Happy US Pet Day!
Ken Flerlage (@flerlagekr) 's Twitter Profile Photo

For a while now, I've been working on 6 new sankey templates. Thrilled to finally share them with the world. kenflerlage.com/2019/04/more-s…

Data Visualization Society (@datavizsociety) 's Twitter Profile Photo

Pie charts are evil. Decoration is bad. There are so many rules in #datavisualization & it takes a long time to learn them all. Once you do, Ken Flerlage points out that you then need to learn something even more esoteric and difficult: when to break them. medium.com/data-visualiza…

James Smith | SportsChord (@sportschord) 's Twitter Profile Photo

VISUALISING THE CRICKET SCORECARD 🏏📊 A #CricketWorldCup2019 inspired project to tell the story of a cricket match using data visualisation (data from @cricsheet) Full write up: sportschord.com/visualising-th… Tableau Public : public.tableau.com/profile/sports… #sportsvizsunday
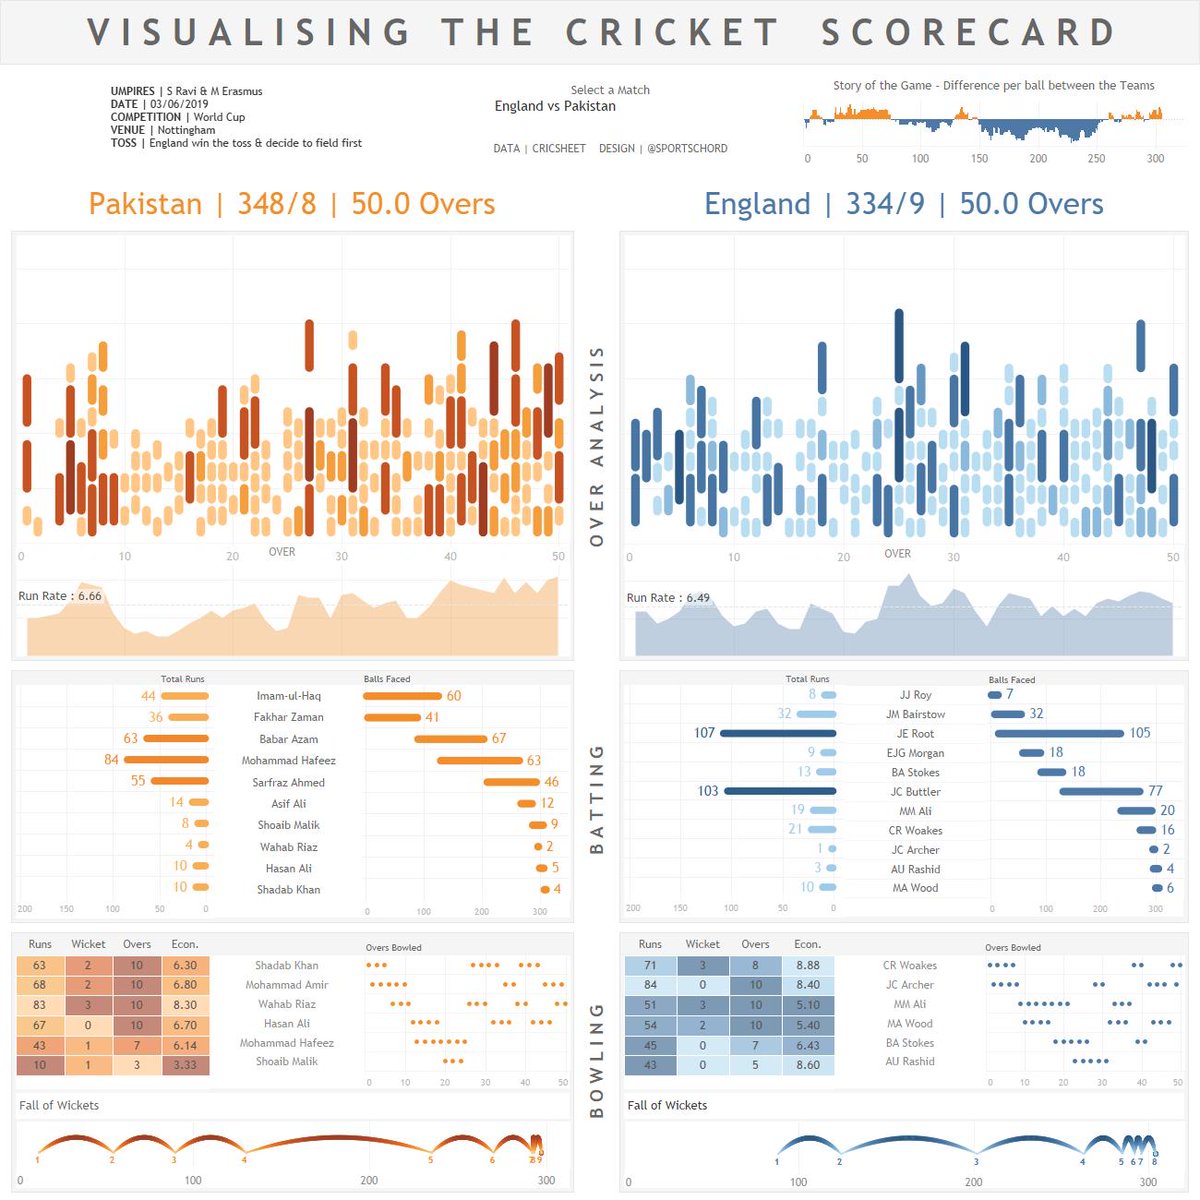
VISUALISING THE CRICKET SCORECARD 🏏📊

A #CricketWorldCup2019 inspired project to tell the story of a cricket match using data visualisation (data from @cricsheet)

Full write up: sportschord.com/visualising-th…
<a href="/tableaupublic/">Tableau Public</a> : public.tableau.com/profile/sports… #sportsvizsunday
Dinushki De Livera (@deevizable) 's Twitter Profile Photo

Here is my Tableau #ironviz entry. Coming from an extremely musical family I dedicate this viz to my 98 year old grandma that still plays the piano every single day!😍 Also huge thanks to @HighVizAbility Kevin Flerlage Jennifer Dawes for all their support! public.tableau.com/views/TheFireb…

RJ Andrews (@infowetrust) 's Twitter Profile Photo

What happened on the #Apollo50 moonwalk? Presenting a 💫new data story with original art, scrolly viz, & animated map. See it on a big screen for a big experience: infowetrust.com/tranquility

Nadieh Bremer (@nadiehbremer) 's Twitter Profile Photo

NEW!! 🎉 Super happy to share a new #dataviz project that visualizes how Planet's satellites creates a full image of Earth's landmass in ONE day! 🌍 See how the Earth is slowly build up from each of the whopping 600,000 images taken in a single day 🛰️ nbremer.github.io/planet-globe/

Brit (@databrit) 's Twitter Profile Photo

It’s always a joy to see RJ Andrews in action! Thanks for guiding us on an adventure with data! We so appreciated the opportunity to learn from and be inspired by you!

It’s always a joy to see <a href="/infowetrust/">RJ Andrews</a> in action! Thanks for guiding us on an adventure with data! We so appreciated the opportunity to learn from and be inspired by you!