Stephanie Hereira (@shereirap) 's Twitter Profile
Stephanie Hereira

@shereirap

PI CICB-UATx. Ph D, Biotechnologist! Colombian! Engineer & Researcher. Tennis player. Speak Spanish & English! email: [email protected]

ID: 106954611

calendar_today21-01-2010 05:03:29

2,2K Tweet

122 Followers

374 Following

PYOFLIFE.COM (@parajulisaroj16) 's Twitter Profile Photo

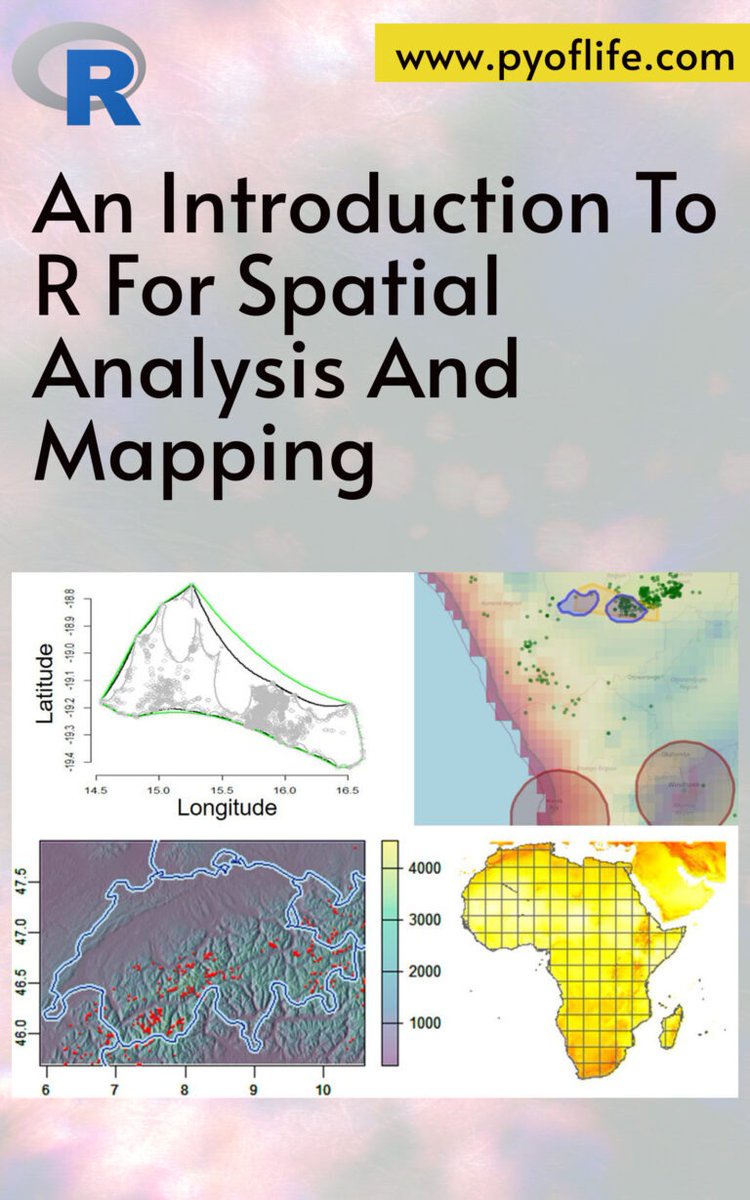
This guide provides an in-depth introduction to using R for spatial analysis and mapping, covering fundamental concepts, techniques, and applications. pyoflife.com/an-introductio… #DataScience #rstats #DataScientists #statistics #SpatialDataAnalysis #datavisualizations #datasets

This guide provides an in-depth introduction to using R for spatial analysis and mapping, covering fundamental concepts, techniques, and applications. pyoflife.com/an-introductio…
#DataScience #rstats #DataScientists #statistics #SpatialDataAnalysis #datavisualizations #datasets
Meixia Zhao (@meixiazhao) 's Twitter Profile Photo

We’ll be hosting the Bioinformatics Summer Workshop from August 11–15. The workshop is completely free and held 100% online. If you are interested, please go ahead and register: sites.google.com/view/bioinfowo…

We’ll be hosting the Bioinformatics Summer Workshop from August 11–15. The workshop is completely free and held 100% online. If you are interested, please go ahead and register: sites.google.com/view/bioinfowo…
Jan Broder Engler (@janbroderengler) 's Twitter Profile Photo

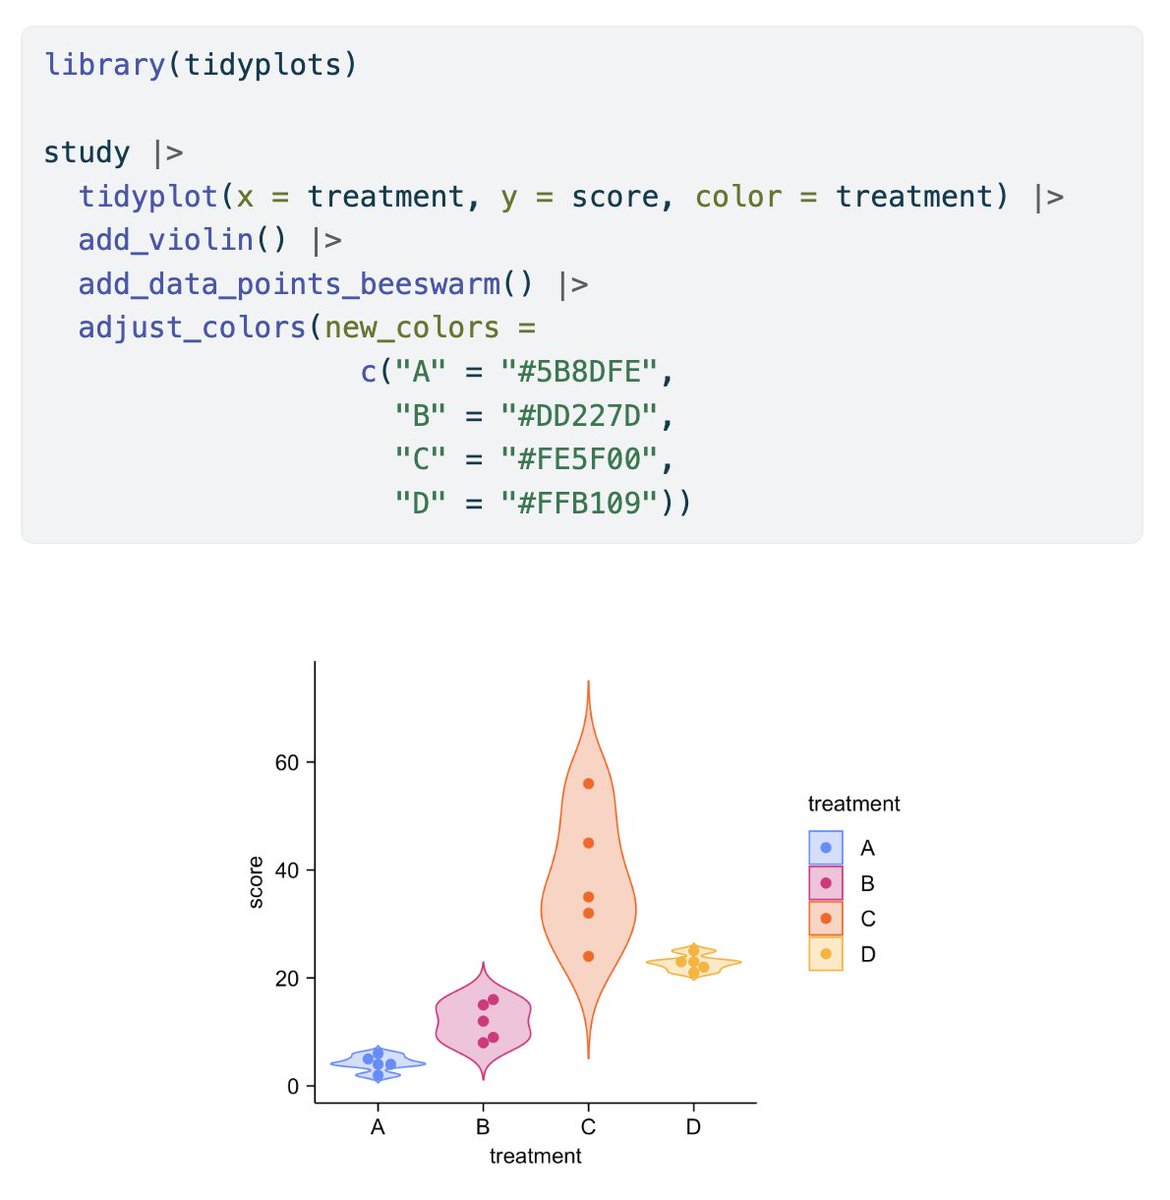
This is how you can add normal data ellipses in #tidyplots 0.3.1 🐣 Based on: ggplot2.tidyverse.org/reference/stat… #rstats #dataviz #phd

This is how you can add normal data ellipses in #tidyplots 0.3.1 🐣

Based on: ggplot2.tidyverse.org/reference/stat…

#rstats #dataviz #phd
PYOFLIFE.COM (@parajulisaroj16) 's Twitter Profile Photo

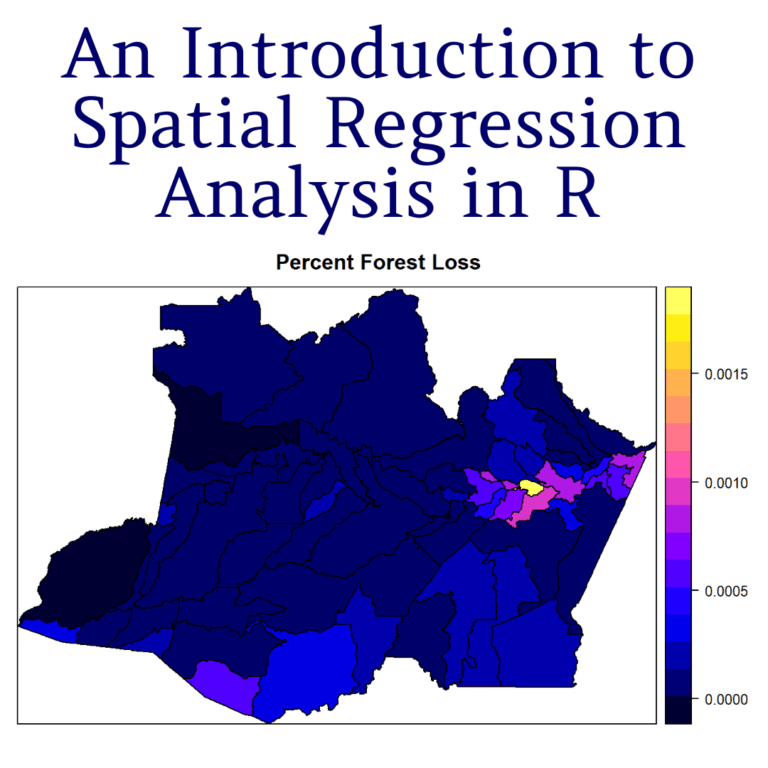
📌📚Spatial regression analysis allows us to identify and quantify the spatial patterns in data and to make predictions based on these patterns. pyoflife.com/an-introductio… #DataScience #rstats #DataScientists #statistics #spatialanalysis #regression #mathematics #datavisualizations

📌📚Spatial regression analysis allows us to identify and quantify the spatial patterns in data and to make predictions based on these patterns. pyoflife.com/an-introductio…
#DataScience #rstats #DataScientists #statistics #spatialanalysis #regression #mathematics #datavisualizations
PYOFLIFE.COM (@parajulisaroj16) 's Twitter Profile Photo

Embark on a fascinating journey into the realm of data science in R with this comprehensive guide designed for social scientists. pyoflife.com/doing-data-sci… #DataScience #RStats #DataScientists #statistics #machinelearning #ArtificialInteligence #DataAnalytics #datavisualizations

Embark on a fascinating journey into the realm of data science in R with this comprehensive guide designed for social scientists. pyoflife.com/doing-data-sci…
#DataScience #RStats #DataScientists #statistics #machinelearning #ArtificialInteligence #DataAnalytics #datavisualizations
Joachim Schork (@joachimschork) 's Twitter Profile Photo

Visualize genomic data with ease using gggenomes, an R package that extends ggplot2 to handle and display genomic information intuitively. Whether you’re comparing genomes, analyzing features, or showcasing synteny, gggenomes provides the tools you need to turn complex genomic

Visualize genomic data with ease using gggenomes, an R package that extends ggplot2 to handle and display genomic information intuitively. Whether you’re comparing genomes, analyzing features, or showcasing synteny, gggenomes provides the tools you need to turn complex genomic
Science News (@sciencenews) 's Twitter Profile Photo

H5N1 bird flu might infect human mammary glands, potentially allowing the virus to show up in breast milk. sciencenews.org/article/h5n1-b…

Stephanie Hereira (@shereirap) 's Twitter Profile Photo

📢 ¿Quieres aprender a programar en R para analizar datos biológicos? ¡Inscríbete al Curso: R Básico para Ciencia de Datos! 📷 📊

📢 ¿Quieres aprender a programar en R para analizar datos biológicos? ¡Inscríbete al Curso: R Básico para Ciencia de Datos! 📷 📊
𝙅𝘿 (@juanndis) 's Twitter Profile Photo

Nadie nos preparó para este momento que estamos viviendo. Nadie nos enseñó cómo vivir sin Lionel Andrés Messi. Mira lo emocionado que está. Se nos está yendo lo más grande que tenemos y que tuvo el fútbol. Que lo parió.

Cameron Thrash (@jcamthrash) 's Twitter Profile Photo

MAGdb: a comprehensive high quality MAGs repository for exploring microbial metagenome-assemble genomes genomebiology.biomedcentral.com/articles/10.11…

Rosana Ferrero 📈📊🙌 (@rosanaferrero) 's Twitter Profile Photo

🎯 ¿Cuánto es suficiente? La eterna pregunta cuando vas a diseñar un estudio o experimento: ¿Con 30 muestras basta? ¿Y si pongo 100 para estar seguro? ¿O mejor 300 para que nadie me critique? 🤯 La verdad es que… ni muy pocas ni demasiadas.🧵 #stats #Estadística #DataScience

Cameron Thrash (@jcamthrash) 's Twitter Profile Photo

Evaluation of full-length 16S rRNA amplicon sequencing using Oxford Nanopore Technologies for diversity surveys of understudied microbiomes biorxiv.org/content/10.110…

R Markdown (@rmarkdown) 's Twitter Profile Photo

🚀 Best Practices for R — in one cheat sheet! github.com/wurli/r-best-p… by Jacob Scott #rstats #rmarkdown #quartopub #tidyverse #ggplot2 #dataviz

🚀 Best Practices for R — in one cheat sheet!
 github.com/wurli/r-best-p…
by <a href="/_wurli/">Jacob Scott</a>
#rstats #rmarkdown #quartopub #tidyverse #ggplot2 #dataviz