David Roycroft (@davidroycroft6) 's Twitter Profile
David Roycroft

@davidroycroft6

Statistics Graduate Student at Virginia Tech. Statistical consultant for SAIG @ VT github.com/DavidRoy4/Proj…

ID: 1427335194038595586

calendar_today16-08-2021 18:23:32

17 Tweet

17 Followers

54 Following

David Roycroft (@davidroycroft6) 's Twitter Profile Photo

Here are some quick graphs I made from some NBA tracking data I found on nba.com. I wanted to highlight a few players to illustrate some differences in age, position, and playing style. All of the code and data used can be found on my GitHub.

Here are some quick graphs I made from some NBA tracking data I found on nba.com. I wanted to highlight a few players to illustrate some differences in age, position, and playing style. All of the code and data used can be found on my GitHub.
David Roycroft (@davidroycroft6) 's Twitter Profile Photo

My entry in the #wildpackdataviz challenge. It was a fun opportunity to be creative and make a graph in under an hour! Also thanks to @_b4billy_ for helping with the visualization. #whockey NC State Sports Analytics Club
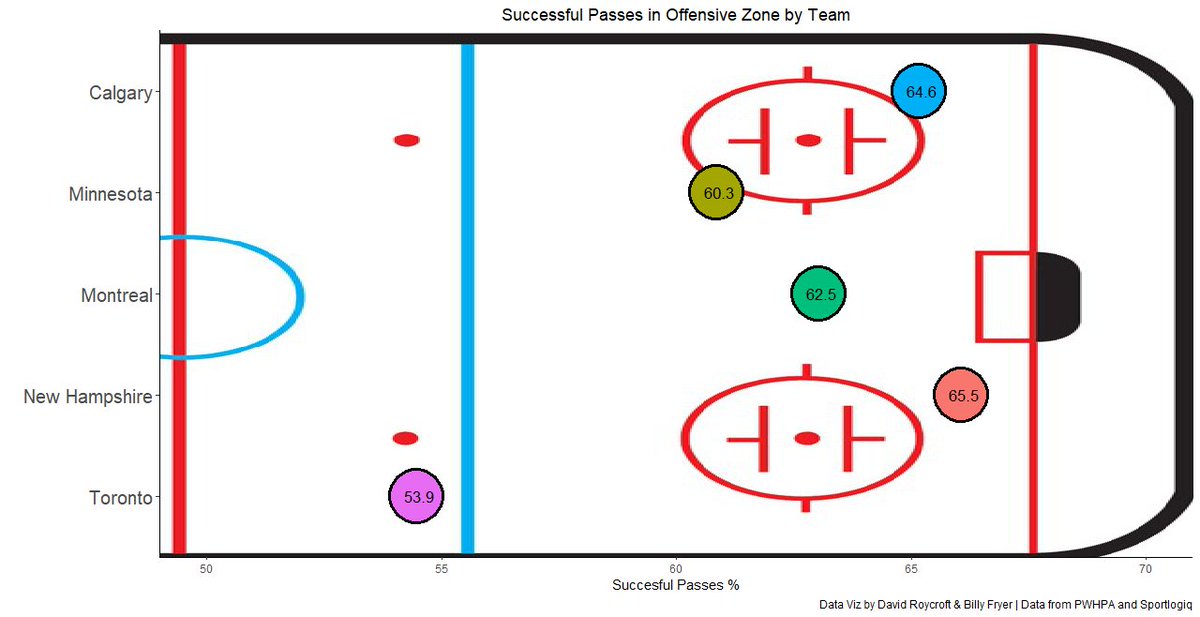
My entry in the #wildpackdataviz challenge. It was a fun opportunity to be creative and make a graph in under an hour! Also thanks to @_b4billy_ for helping with the visualization. #whockey <a href="/ncsusac/">NC State Sports Analytics Club</a>
David Roycroft (@davidroycroft6) 's Twitter Profile Photo

Here is a graph representing the FG% allowed by each player who finished in the top 5 of DPOY voting in the 2019-20 season. The FG% is adjusted by league average shot frequencies from different court locations. NC State Sports Analytics Club
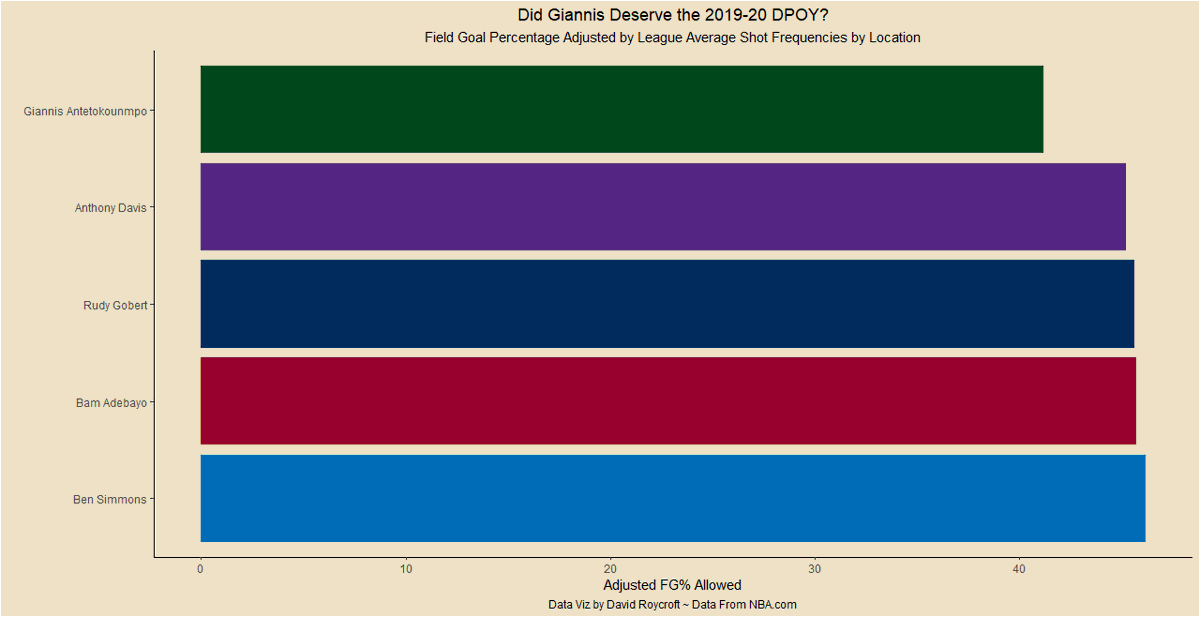
Here is a graph representing the FG% allowed by each player who finished in the top 5 of DPOY voting in the  2019-20 season. The FG% is adjusted by league average shot frequencies from different court locations. <a href="/ncsusac/">NC State Sports Analytics Club</a>
David Roycroft (@davidroycroft6) 's Twitter Profile Photo

Here are some graphs showing Adjusted Offensive and Defensive efficiency against wins for teams that made the 2021 NCAA tournament. The logos are visible for each team that made the Elite 8 in the tournament. NC State Sports Analytics Club
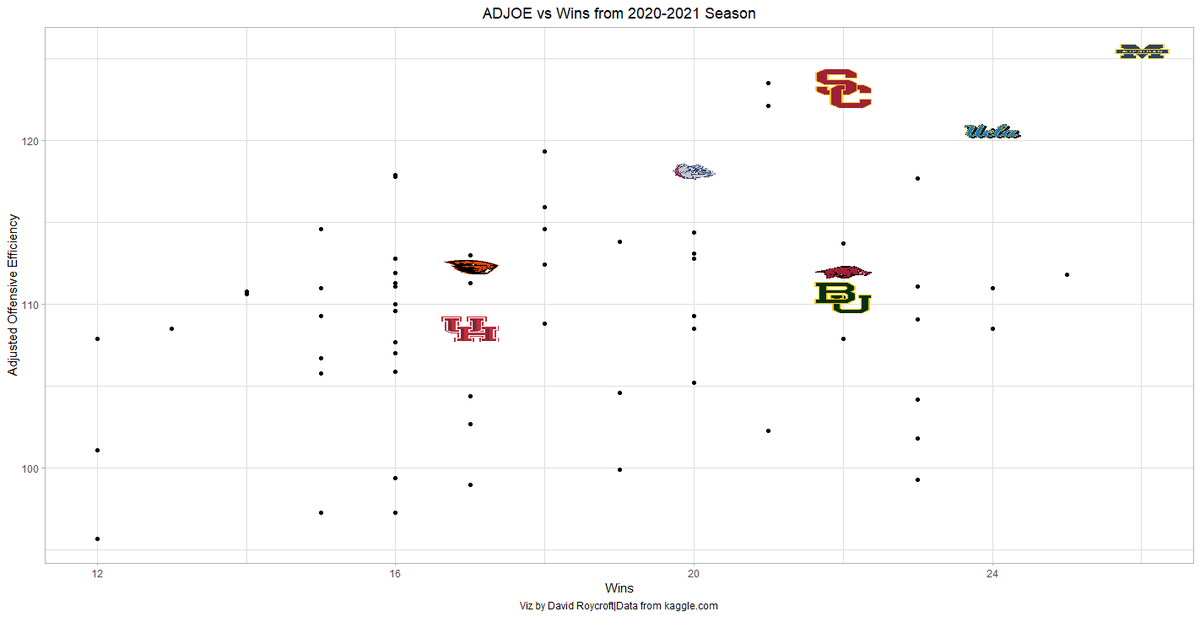
Here are some graphs showing Adjusted Offensive and Defensive efficiency against wins for teams that made the 2021 NCAA tournament. The logos are visible for each team that made the Elite 8 in the tournament. <a href="/ncsusac/">NC State Sports Analytics Club</a>
David Roycroft (@davidroycroft6) 's Twitter Profile Photo

Another graph of the 2021 NCAA Tournament that shows the number of bids per conference (min. 4 bids) and each seed within those bids.

Another graph of the 2021 NCAA Tournament that shows the number of bids per conference (min. 4 bids) and each seed within those bids.
David Roycroft (@davidroycroft6) 's Twitter Profile Photo

I recently got into playing chess so I wanted to make a quick graph to look at my chess games. I wanted to make a time-series type graph, but the data was too variable. Maybe you'll enjoy seeing my mistakes and progress or want to see more chess related graphs in the future!

I recently got into playing chess so I wanted to make a quick graph to look at my chess games. I wanted to make a time-series type graph, but the data was too variable. Maybe you'll enjoy seeing my mistakes and progress or want to see more chess related graphs in the future!
David Roycroft (@davidroycroft6) 's Twitter Profile Photo

Who are the real college basketball "blue bloods"? Here are a few quick graphs showing heat maps of NCAA title wins, losses, and appearances by state. NC State Sports Analytics Club
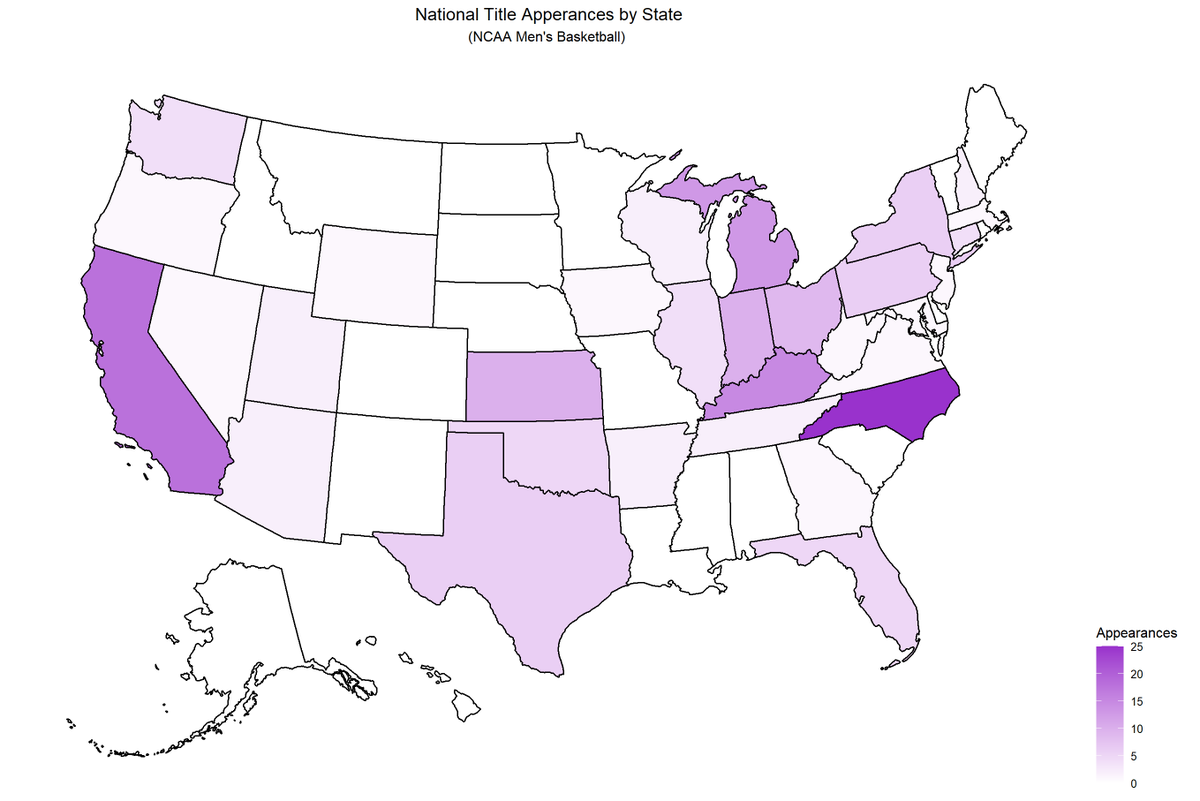
Who are the real college basketball "blue bloods"? Here are a few quick graphs showing heat maps of NCAA title wins, losses, and appearances by state. 
<a href="/ncsusac/">NC State Sports Analytics Club</a>
David Roycroft (@davidroycroft6) 's Twitter Profile Photo

Who has over-performed and under-performed in the playoffs? Here is a quick look into the differences between Player Efficiency Ratings in the playoffs compared to the regular season on both an individual and team level.

Who has over-performed and under-performed in the playoffs? Here is a quick look into the differences between Player Efficiency Ratings in the playoffs compared to the regular season on both an individual and team level.