#Bitcoin chArtist (@bitcoinchart) 's Twitter Profile
#Bitcoin chArtist

@bitcoinchart

I make Bitcoin charts to help you navigate the Bitcoin market. Follow me for statistics-based models and signals.

ID: 1783131159293038592

linkhttps://bitcoinchart.app calendar_today24-04-2024 13:49:49

3,3K Tweet

7,7K Followers

274 Following

#Bitcoin chArtist (@bitcoinchart) 's Twitter Profile Photo

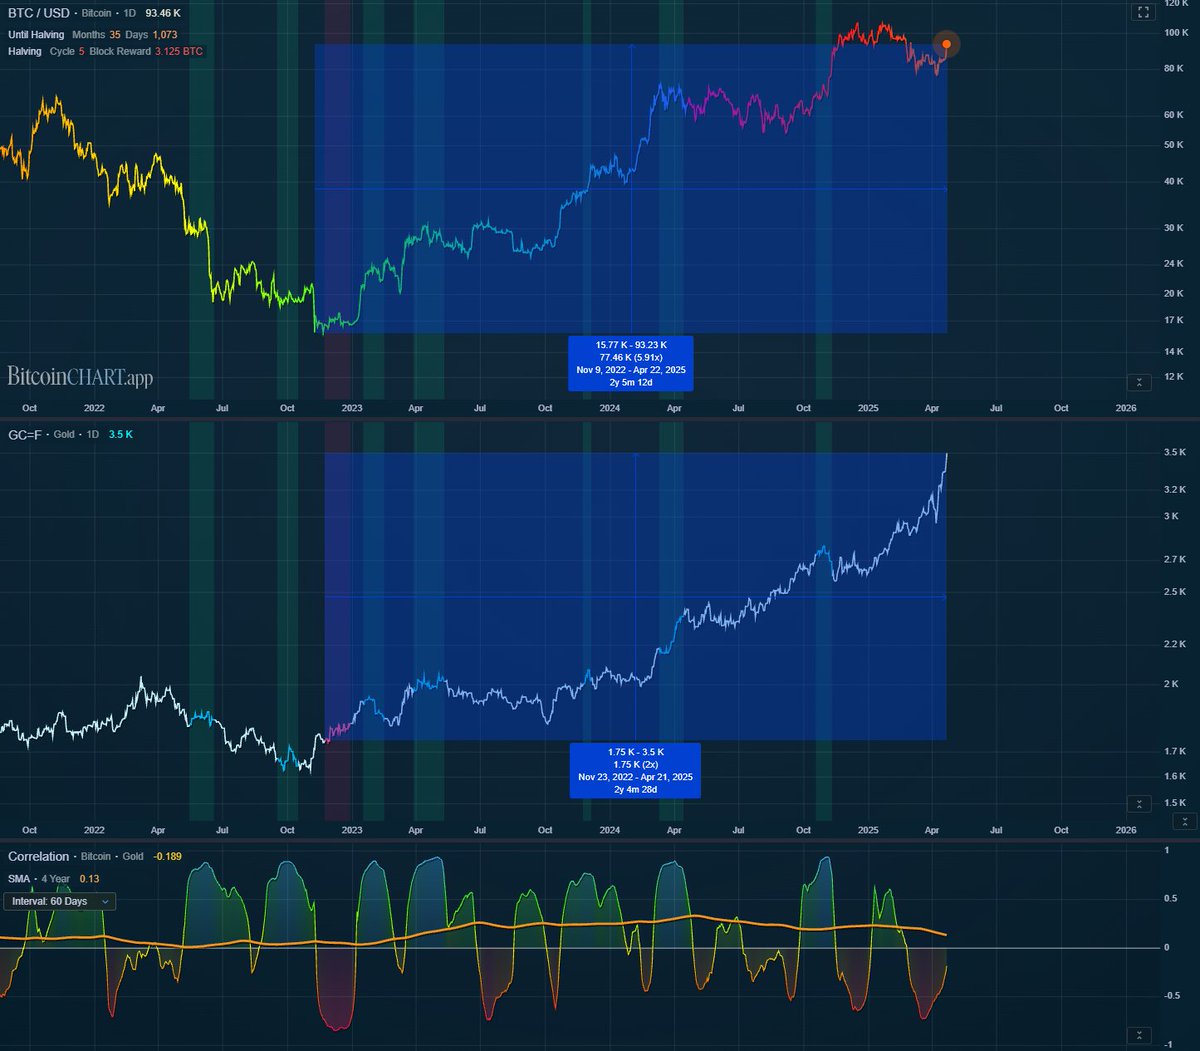
BITCOIN vs GOLD Nov'22 - NOW Bitcoin: $15.7k -> $93.2k = 6X Gold: $1.75k -> $3.5k = 2X I don't want to hear from those dimwits like Peter Schiff, who are suggesting Gold is outperforming Bitcoin LINK: bitcoinchart.app/bitcoin/gold-cโ€ฆ

BITCOIN vs GOLD Nov'22 - NOW  

Bitcoin: $15.7k -> $93.2k = 6X 
Gold: $1.75k -> $3.5k = 2X  

I don't want to hear from those dimwits like <a href="/PeterSchiff/">Peter Schiff</a>, who are suggesting Gold is outperforming Bitcoin

LINK: bitcoinchart.app/bitcoin/gold-cโ€ฆ
#Bitcoin chArtist (@bitcoinchart) 's Twitter Profile Photo

#Bitcoin Q2 UPDATE Bitcoin is up 25.25% in Q2 2025, or 4.02% above 8-Year Quarter-to-Date (QTD) Average ROI of 21.23%. QTD ROI for Day 50 of Q2 in the previous 4 years: 2024: 2.50% 2023: -4.76% 2022: -36.77% 2021: -31.26%

#Bitcoin Q2 UPDATE

Bitcoin is up 25.25% in Q2 2025, or 4.02% above 8-Year Quarter-to-Date (QTD) Average ROI of 21.23%.

QTD ROI for Day 50 of Q2 in the previous 4 years:

2024: 2.50%
2023: -4.76%
2022: -36.77%
2021: -31.26%
#Bitcoin chArtist (@bitcoinchart) 's Twitter Profile Photo

#Bitcoin Havling Cycles UPDATE - Day 396 Bitcoin is up 64.3% since the halving from $64,931 on Apr 20, 2024. Day 396 ROI in the previous 3 halving cycles: May 11, 2020 - Jun 11, 2021: +332.9% Jul 9, 2016 - Aug 9, 2017: +414.0% Nov 28, 2012 - Dec 29, 2013: +5,937.7%

#Bitcoin Havling Cycles UPDATE - Day 396

Bitcoin is up 64.3% since the halving from $64,931 on Apr 20, 2024.

Day 396 ROI in the previous 3 halving cycles:

May 11, 2020 - Jun 11, 2021: +332.9%
Jul 9, 2016 - Aug 9, 2017: +414.0%
Nov 28, 2012 - Dec 29, 2013: +5,937.7%
#Bitcoin chArtist (@bitcoinchart) 's Twitter Profile Photo

#Bitcoin Top To Top Cycles UPDATE - Day 1,290 Bitcoin is up +58.1% since the previous cycle ATH of $67,500 on Nov 8, 2021. Day 1,290 ROI in Previous 3 cycles: 2017 - 2021: +77.3% 2013 - 2017: +118.9% 2011 - 2013: +3,789.1%

#Bitcoin Top To Top Cycles UPDATE - Day 1,290

Bitcoin is up +58.1% since the previous cycle ATH of $67,500 on Nov 8, 2021.

Day 1,290 ROI in Previous 3 cycles:

2017 - 2021: +77.3%
2013 - 2017: +118.9%
2011 - 2013: +3,789.1%
#Bitcoin chArtist (@bitcoinchart) 's Twitter Profile Photo

#Bitcoin MAY UPDATE Bitcoin is up 10.54% this May, or 3.65% above 8-Year Month-to-Date (MTD) Average ROI of 6.90%. May 20 MTD ROI in the previous 4 years: 2024: 22.34% 2023: -3.47% 2022: -24.00% 2021: -30.11%

#Bitcoin MAY UPDATE

Bitcoin is up 10.54% this May, or 3.65% above 8-Year Month-to-Date (MTD) Average ROI of 6.90%.

May 20 MTD ROI in the previous 4 years:

2024: 22.34%
2023: -3.47%
2022: -24.00%
2021: -30.11%
#Bitcoin chArtist (@bitcoinchart) 's Twitter Profile Photo

#Bitcoin Bubble Risk Level is 67.5%. Evaluation: HOLD 0-20: No Risk 20-40: Low 40-60: Neutral 60-80: Moderate 80-100: Bubble Danger

#Bitcoin Bubble Risk Level is 67.5%.

Evaluation: HOLD

0-20: No Risk
20-40: Low
40-60: Neutral
60-80: Moderate
80-100: Bubble Danger
#Bitcoin chArtist (@bitcoinchart) 's Twitter Profile Photo

#Bitcoin Bottom to Top Bull Market UPDATE - Day 912 Bitcoin is up +576.2% since the previous cycle bottom of $15,780 on Nov 21, 2022. Day 912 ROI in Previous 4 cycles: Dec 2018 - Nov 2021: +1,104.6% Jan 2015 - Dec 2017: +1,145.2% Nov 2011 - Dec 2013: +56,054.6% Jul 2010 - Jun

#Bitcoin Bottom to Top Bull Market UPDATE - Day 912

Bitcoin is up +576.2% since the previous cycle bottom of $15,780 on Nov 21, 2022.

Day 912 ROI in Previous 4 cycles:

Dec 2018 - Nov 2021: +1,104.6%
Jan 2015 - Dec 2017: +1,145.2%
Nov 2011 - Dec 2013: +56,054.6%
Jul 2010 - Jun