Anand Mayakonda 🕉️
@anand_mt
Bioinformatics, genetics, and cancer genomics @dkfz. I also tweet #Rstats #dataviz @baseRgraphics
ID: 36113074
28-04-2009 16:42:50
459 Tweet
270 Followers
285 Following

Oh wow! Just saw that our Genome Research article for the #maftools Bioconductor package crossed over 1000 citations. Thanks to all the contributors and users for citing :) Just in time for Bioconductor 3.15 release, with support for CNV, and cancer hotspot report. De-Chen Lin


Do you like #Rstats and #Datavisualization? Follow basegRaphics where I tweet pretty plots (with code and data) generated using pure base graphics with no dependencies. This is for those who like to learn and customize base R plotting functions. #BaseisBeautiful :)


Very excited to share our DNA methylome studies in esophageal cancer, a +5-year long journey with the amazing Ben Berman and yueyuan, started @CSCancerCare and polished CCMB @ USC USC Norris Comprehensive Cancer Center biorxiv.org/content/10.110…


It’s unbelievable how fast #echtvar by brent pedersen is. Annotating a whole genome vcf (5m vars) with gnomad and internal allele frequencies takes < 5mins. 🙌 github.com/brentp/echtvar


🚀 ONLINE Nature Genetics 📰 Neuroblastoma arises in early fetal development and its evolutionary duration predicts outcome 🧑🏽🤝🧑🏻 Verena Körber, Frank Westermann, Thomas Höfer, and team ⬇️ go.nature.com/3TR7aqW #neuroblastoma Cancer at Nature Portfolio

squaRify - A minimal, zero dependency package for drawing treemaps in R. Inspired by Uri Laserson's squarify python implementation github.com/PoisonAlien/sq… #treemaps #rstats


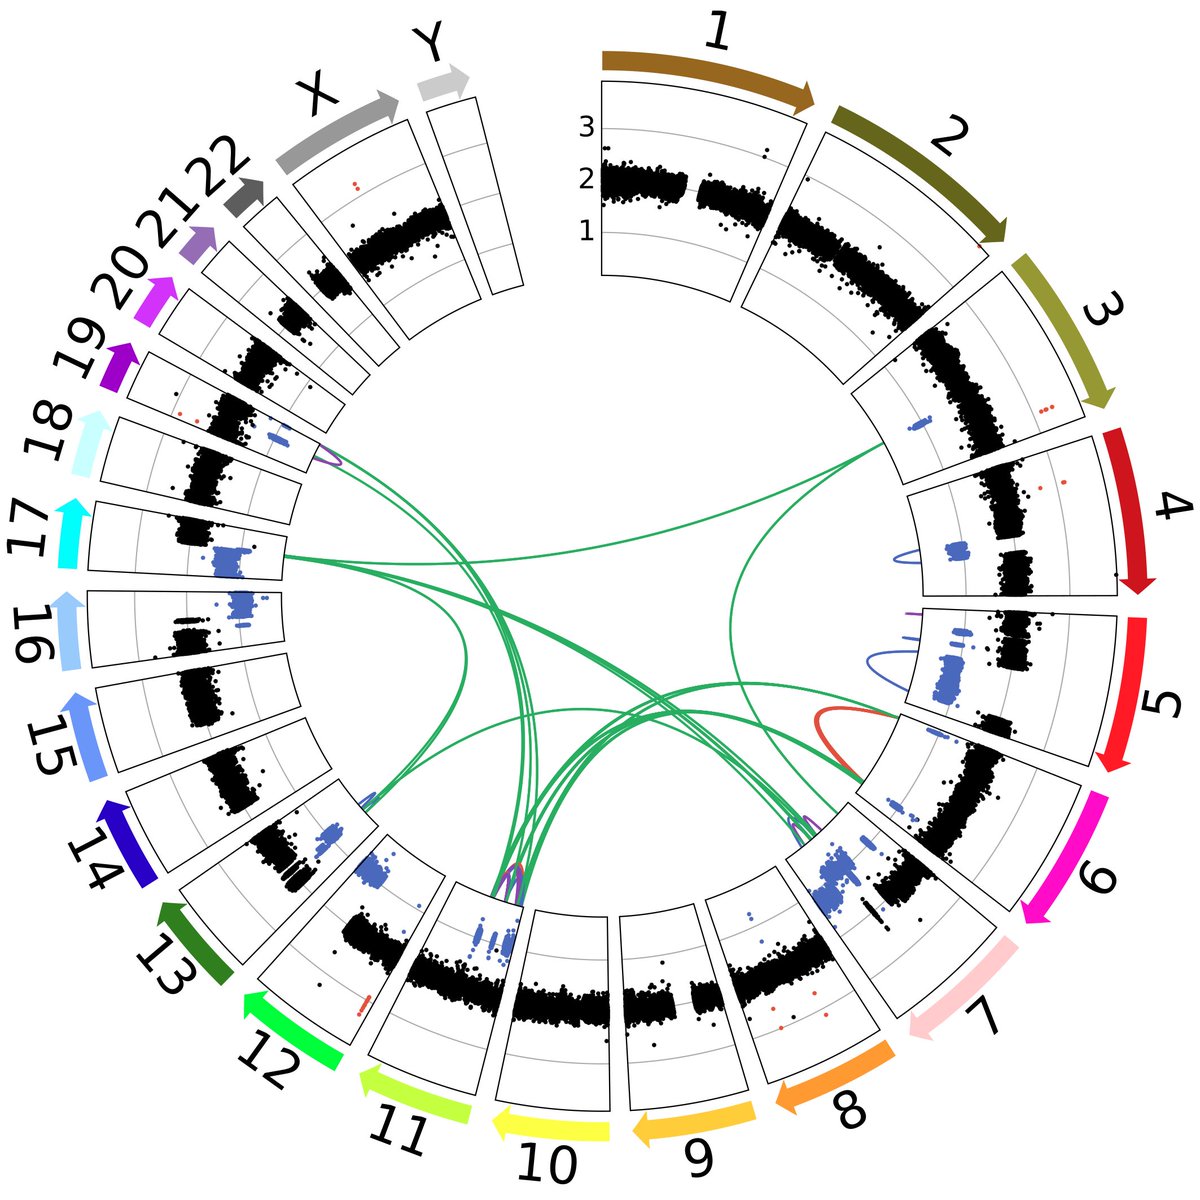
Introducing figeno, my visualization software for (epi)genomics🧬🎨. Supports many data types (bigwig, HiC, Oxford Nanopore data with base modifications, WGS...) and is easy to use with a GUI. Can visualize multiple regions (e.g. for breakpoints). github.com/CompEpigen/fig…


