The Chart Historian (@charthistorian) 's Twitter Profile
The Chart Historian

@charthistorian

Follow me for a unique perspective on #crypto #TechnicalAnalysis. I specialize in repetitive chart structures and fractals. Not Financial/Investment Advice.

ID: 1528458924407627784

linkhttps://www.youtube.com/channel/UC_dQ7Q7BMxn15-bKshaAoNA calendar_today22-05-2022 19:36:34

1,1K Tweet

928 Followers

46 Following

The Chart Historian (@charthistorian) 's Twitter Profile Photo

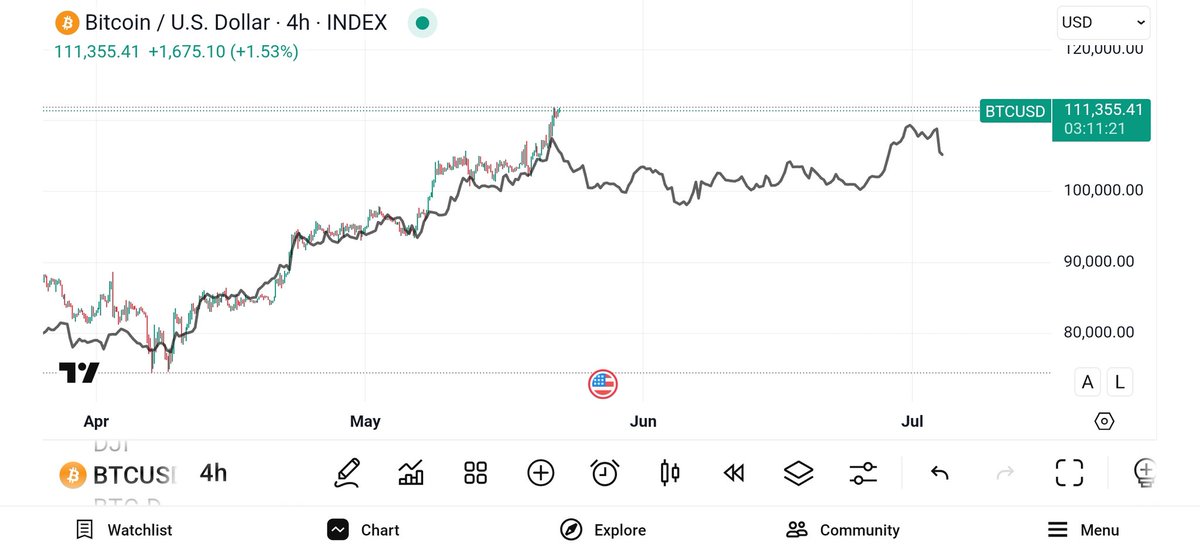
Today's #Bitcoin chart has so far done a beautiful job of following this 2021 bull run peak fractal as it has moved up. I have mentioned this possibility in my recent videos. My hope is that as #BTC moves into the remaining part of this peak structure, #Crypto comes to life.

Today's #Bitcoin chart has so far done a beautiful job of following this 2021 bull run peak fractal as it has moved up. I have mentioned this possibility in my recent videos. My hope is that as #BTC moves into the remaining part of this peak structure, #Crypto comes to life.
The Chart Historian (@charthistorian) 's Twitter Profile Photo

$CSPR is reaching a point where it is going to move up. In this video I present a few different possibilities that could happen BEFORE the next move up. youtu.be/mFVjrFXBbNg

The Chart Historian (@charthistorian) 's Twitter Profile Photo

In this video I show you a repetitive macro structure the #Nasdaq has, and how this structure hints at a coming window of time for a #crypto #BullRun. youtu.be/MI1jy_1kUhY

The Chart Historian (@charthistorian) 's Twitter Profile Photo

In this video, for the first time, I deep dive into the repetitive macro structure the #DowJones has. I show how the coming 1929-style crash will be different than the #greatrecession, the #dotcom crash, or the 1987 #stockmarketcrash. youtu.be/2_Cjz9DEmys

The Chart Historian (@charthistorian) 's Twitter Profile Photo

Every day matters right now! The indexes don't have much time before they turn over. #XRP approaches a key moment where a new ATH is possible. In this video, I show you how a possible ATH coincides within a window of time in the larger market before the decline begins.

The Chart Historian (@charthistorian) 's Twitter Profile Photo

#Bitcoin, the #StockMarket and #Altcoins are at a key moment. We could be at a market peak now and many don't see it. youtu.be/AhoKwwLqWE4

The Chart Historian (@charthistorian) 's Twitter Profile Photo

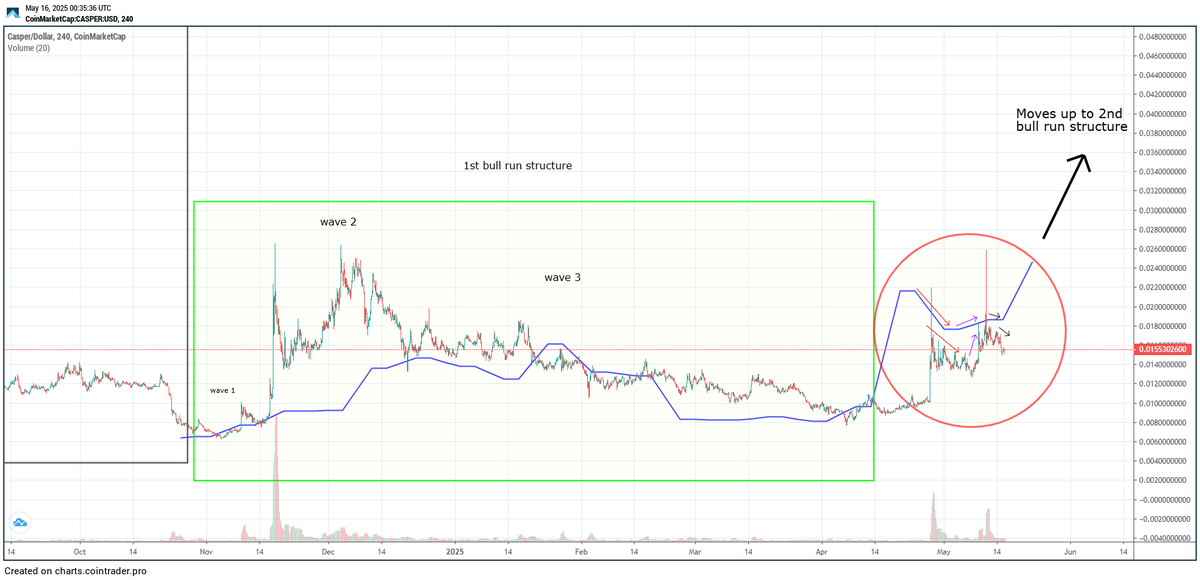
$CSPR update: This is a recent history fractal from November 2024 to April 2025. As you can see today's chart has printed a similar structure. If #CSPR continues following this fractal a move up could be near. As I discussed in my recent Casper video, CSPR's big move may likely

$CSPR update:
This is a recent history fractal from November 2024 to April 2025. As you can see today's chart has printed a similar structure. If #CSPR continues following this fractal a move up could be near. 

As I discussed in my recent Casper video, CSPR's big move may likely
The Chart Historian (@charthistorian) 's Twitter Profile Photo

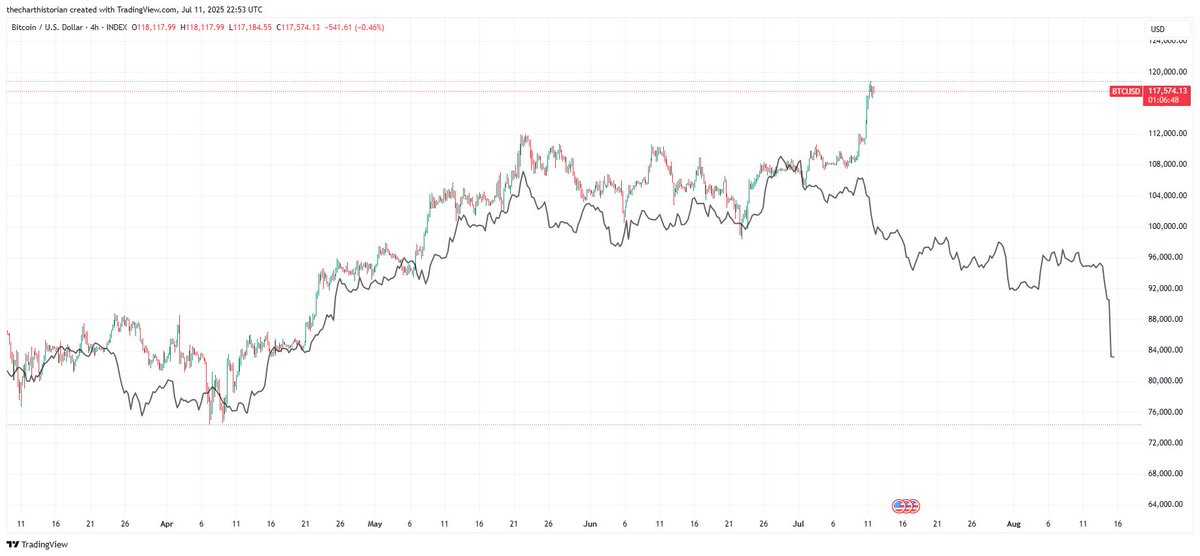
#Bitcoin has been repeating its 2021 bull run peak structure for sometime now. Per this fractal what comes next is the start of the decline. It's possible #BTC could still climb up a bit further before beginning the decline, having said that, it does look like it could begin

#Bitcoin has been repeating its 2021 bull run peak structure for sometime now. Per this fractal what comes next is the start of the decline. It's possible #BTC could still climb up a bit further before beginning the decline, having said that, it does look like it could begin
The Chart Historian (@charthistorian) 's Twitter Profile Photo

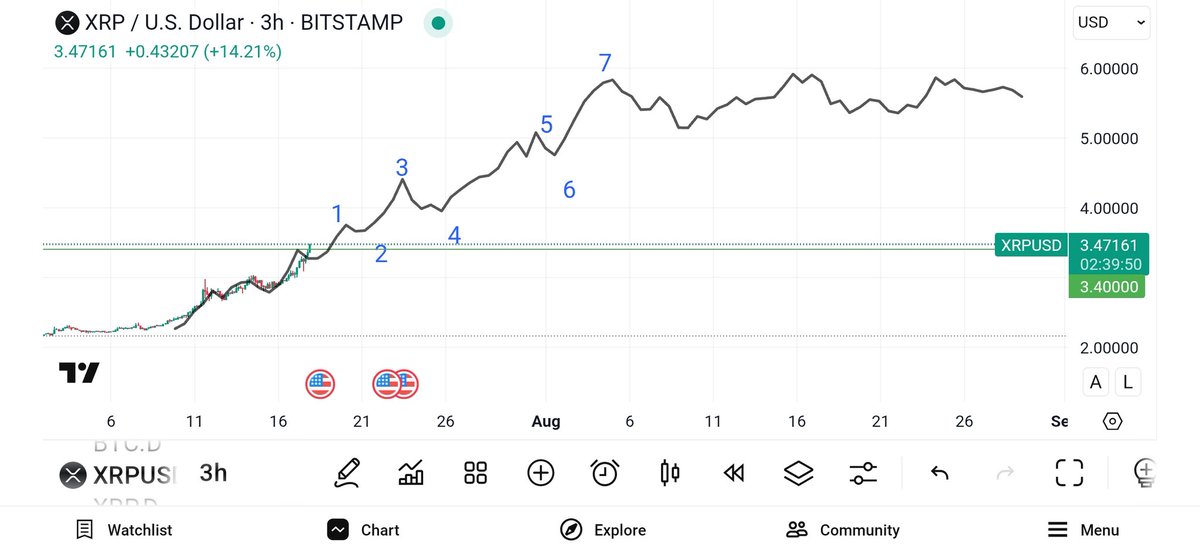
#XRP price is above the previous ATH. The watch for the 7 moves to the peak begins. This fractal is only a visual illustration of how it could potentially play out. Here is a video that explains the 7 moves to the peak. youtu.be/w6Dtcp2KgJs

#XRP price is above the previous ATH. The watch for the 7 moves to the peak begins. This fractal is only a visual illustration of how it could potentially play out. 

Here is a video that explains the 7 moves to the peak. 
youtu.be/w6Dtcp2KgJs
The Chart Historian (@charthistorian) 's Twitter Profile Photo

Is this the start of a new #XRP bull run, or are we deep into an existing bull run heading to the peak? There is only one answer to this question. youtu.be/3U3ZKo-AH3Y

The Chart Historian (@charthistorian) 's Twitter Profile Photo

The black fractal is the circled part of the blue $CSPR fractal from 2021 stretched to match today's chart after the decline. As of now this part of the fractal seems to be playing out on a larger scale. In my last #CSPR video I showed how in the past Casper moved up after #BTC

The black fractal is the circled part of the blue $CSPR fractal from 2021 stretched to match today's chart after the decline. As of now this part of the fractal seems to be playing out on a larger scale. In my last #CSPR video I showed how in the past Casper moved up after #BTC
The Chart Historian (@charthistorian) 's Twitter Profile Photo

We are at the threshold of a big move that will catapult #XRP to the bull run peak. There are 7 moves to the $XRP bull run peak. Find out where we are, and what we have left to go. youtu.be/4wg41lg7xJw