Baxia Markets (@baxiamarkets) 's Twitter Profile
Baxia Markets

@baxiamarkets

📈 The latest #trading news & insights on global financial markets! 🌏
All trading involves risk. linktr.ee/baxiamarkets

ID: 1220711315255197696

linkhttp://baxiamarkets.com calendar_today24-01-2020 14:14:05

3,3K Tweet

513 Takipçi

244 Takip Edilen

Baxia Markets (@baxiamarkets) 's Twitter Profile Photo

📉 #Gold (XAUUSD) Technical Analysis Update 📉 #XAUUSD #GOLD The current market analysis for XAUUSD highlights several key technical indicators: 161.8% Fibonacci Extension: The market has reached the 161.8% Fibonacci extension level, which often acts as a significant support
📉 #Gold (XAUUSD) Technical Analysis Update 📉

#XAUUSD #GOLD The current market analysis for XAUUSD highlights several key technical indicators:

161.8% Fibonacci Extension: The market has reached the 161.8% Fibonacci extension level, which often acts as a significant support
Baxia Markets (@baxiamarkets) 's Twitter Profile Photo

Analyzing the updated #XAUUSD chart, we observe several key points: The market is currently respecting a descending trendline 📉, highlighting the prevailing 🐻 bearish trend. The key level of resistance, marked in turquoise, indicates a significant area where sellers are likely

Analyzing the updated #XAUUSD chart, we observe several key points:

The market is currently respecting a descending trendline 📉, highlighting the prevailing 🐻 bearish trend. The key level of resistance, marked in turquoise, indicates a significant area where sellers are likely
Baxia Markets (@baxiamarkets) 's Twitter Profile Photo

The EMA 50 and EMA 200 have formed a golden cross, confirming a bullish reversal 📈. The Ichimoku indicators, including Kijun-sen, Tenkan-sen, and Chikou Span, are all positioned above the cloud, reinforcing the major bullish trend. Prices are currently trading above the value

The EMA 50 and EMA 200 have formed a golden cross, confirming a bullish reversal 📈. The Ichimoku indicators, including Kijun-sen, Tenkan-sen, and Chikou Span, are all positioned above the cloud, reinforcing the major bullish trend.

Prices are currently trading above the value
Baxia Markets (@baxiamarkets) 's Twitter Profile Photo

#XAUUSD has shown a strong bullish movement from the Asian to European trading sessions. The price action has been advancing higher within an ascending channel, indicating sustained upward momentum. Key Levels Resistance Levels:161.8% Fibonacci Extension: This level is around

#XAUUSD has shown a strong bullish movement from the Asian to European trading sessions. The price action has been advancing higher within an ascending channel, indicating sustained upward momentum.

Key Levels

Resistance Levels:161.8% Fibonacci Extension: This level is around
Baxia Markets (@baxiamarkets) 's Twitter Profile Photo

Yesterday's death cross, where the 50 EMA crossed below the 200 EMA, signals a bearish trend. The price, along with Kijun Sen, Tenkan Sen, and Chikou Span, is below the Ichimoku Cloud, reinforcing this outlook. Key support is at $2365 while resistance aligns with the 50 and 200

Yesterday's death cross, where the 50 EMA crossed below the 200 EMA, signals a bearish trend. The price, along with Kijun Sen, Tenkan Sen, and Chikou Span, is below the Ichimoku Cloud, reinforcing this outlook.

Key support is at $2365 while resistance aligns with the 50 and 200
Baxia Markets (@baxiamarkets) 's Twitter Profile Photo

The EMA 50 is currently below the EMA 200, indicating a bearish major trend. However, today's upward bend of the EMA 50 towards the EMA 200 suggests that the bearish momentum is weakening. Oscillators are also showing bullish signals, with the MACD signal line and histogram both

The EMA 50 is currently below the EMA 200, indicating a bearish major trend. However, today's upward bend of the EMA 50 towards the EMA 200 suggests that the bearish momentum is weakening. Oscillators are also showing bullish signals, with the MACD signal line and histogram both
Baxia Markets (@baxiamarkets) 's Twitter Profile Photo

#XAUUSD bulls have sustained their momentum, resulting in a golden cross where the EMA 50 has crossed above the EMA 200, signaling a confirmed bullish reversal. Key support levels now align with the EMA 50 and EMA 200, which have moved into what was once a resistance zone, now

#XAUUSD bulls have sustained their momentum, resulting in a golden cross where the EMA 50 has crossed above the EMA 200, signaling a confirmed bullish reversal. Key support levels now align with the EMA 50 and EMA 200, which have moved into what was once a resistance zone, now
Baxia Markets (@baxiamarkets) 's Twitter Profile Photo

#XAUUSD Market Update: Bears Dominate Asian Session, Support Holds in Europe XAUUSD experienced a bearish impulse move during the Asian trading session, marking a significant shift in momentum. However, the market found crucial support during the European session at $2,458.70,

#XAUUSD Market Update: Bears Dominate Asian Session, Support Holds in Europe

XAUUSD experienced a bearish impulse move during the Asian trading session, marking a significant shift in momentum. However, the market found crucial support during the European session at $2,458.70,
Baxia Markets (@baxiamarkets) 's Twitter Profile Photo

Gold has been trading sideways since yesterday, testing a key resistance level at $2477.14. The RBS (Resistance Becomes Support) level is holding strong, keeping the price within a tight range. If we see a break above $2477.14, a potential rally towards the $2500 mark could be

Gold has been trading sideways since yesterday, testing a key resistance level at $2477.14. The RBS (Resistance Becomes Support) level is holding strong, keeping the price within a tight range.

If we see a break above $2477.14, a potential rally towards the $2500 mark could be
Baxia Markets (@baxiamarkets) 's Twitter Profile Photo

#Gold faced a bearish impulse yesterday due to disappointing US CPI data but has since found support near the EMA 200, rebounding sharply to recoup over 50% of those losses. Now, it's testing the upper Bollinger Band, which aligns with the 61.8% Fibonacci retracement. Bulls

#Gold faced a bearish impulse yesterday due to disappointing US CPI data but has since found support near the EMA 200, rebounding sharply to recoup over 50% of those losses. 

Now, it's testing the upper Bollinger Band, which aligns with the 61.8% Fibonacci retracement. Bulls
Baxia Markets (@baxiamarkets) 's Twitter Profile Photo

🚨 EURUSD Update: Sideways Action Amid EU CPI 🚨 EURUSD on the M15 chart is experiencing a sideways movement, continuing through both the Asian and European trading sessions. The EU CPI came in as expected at 2.6%, but this data did not provide the bullish momentum needed to

🚨 EURUSD Update: Sideways Action Amid EU CPI 🚨

EURUSD on the M15 chart is experiencing a sideways movement, continuing through both the Asian and European trading sessions. The EU CPI came in as expected at 2.6%, but this data did not provide the bullish momentum needed to
Baxia Markets (@baxiamarkets) 's Twitter Profile Photo

#Gold (XAU/USD) has been trading sideways over the past two business days, showing signs of consolidation. After breaking Monday's weak high on August 19th, the market pushed to a new high on Tuesday, only to retrace and enter a sideways trading pattern. Currently, the market is

#Gold (XAU/USD) has been trading sideways over the past two business days, showing signs of consolidation. After breaking Monday's weak high on August 19th, the market pushed to a new high on Tuesday, only to retrace and enter a sideways trading pattern.

Currently, the market is
Baxia Markets (@baxiamarkets) 's Twitter Profile Photo

GBPJPY has been in a consolidation phase for the past few days, forming a triangle chart pattern. The pair is at a critical juncture, with bullish momentum suggesting a potential move towards the supply zone. However, if the market fails to break above the triangle, a retracement

GBPJPY has been in a consolidation phase for the past few days, forming a triangle chart pattern. The pair is at a critical juncture, with bullish momentum suggesting a potential move towards the supply zone. However, if the market fails to break above the triangle, a retracement
Baxia Markets (@baxiamarkets) 's Twitter Profile Photo

#EURUSD has been on a bearish trend over the past four days, finding support at 1.1071. Key resistance lies at 1.1125, coinciding with a supply zone. Today’s key event is the release of Core CPI data. A higher-than-expected CPI could push EURUSD above the supply zone, while a

#EURUSD has been on a bearish trend over the past four days, finding support at 1.1071. Key resistance lies at 1.1125, coinciding with a supply zone. Today’s key event is the release of Core CPI data. A higher-than-expected CPI could push EURUSD above the supply zone, while a
Baxia Markets (@baxiamarkets) 's Twitter Profile Photo

GBPUSD remains bearish despite strong candles. 🚩 A move isn't significant unless it breaks the supply zones, particularly the highest one marked in red. If it fails to breach, we could see a further drop towards 1.3050 and 1.3000. 📉 #GBPUSD #Forex #Trading #MarketAnalysis

GBPUSD remains bearish despite strong candles. 🚩 A move isn't significant unless it breaks the supply zones, particularly the highest one marked in red. If it fails to breach, we could see a further drop towards 1.3050 and 1.3000. 📉 #GBPUSD #Forex #Trading #MarketAnalysis
Baxia Markets (@baxiamarkets) 's Twitter Profile Photo

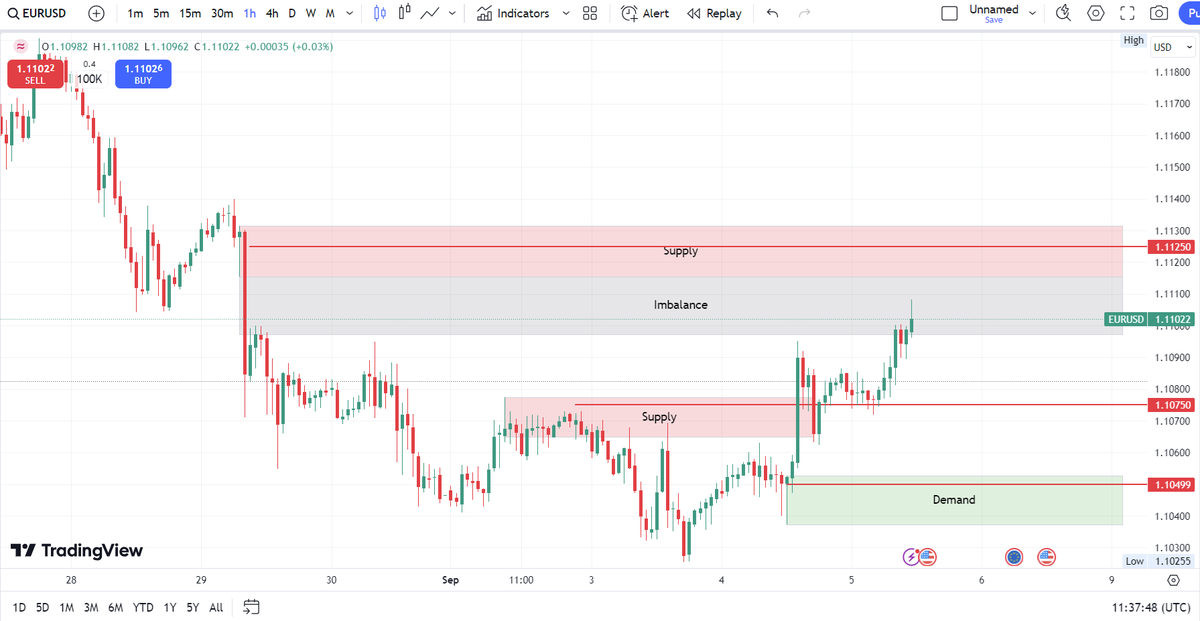
EURUSD is maintaining a bullish trend, heading toward the next supply zone at 1.1125. The price is currently within an imbalance zone and is likely to fill the entire fair value gap (FVG) before reaching the supply zone above. Key support is at 1.1050, situated in the demand zone

EURUSD is maintaining a bullish trend, heading toward the next supply zone at 1.1125. The price is currently within an imbalance zone and is likely to fill the entire fair value gap (FVG) before reaching the supply zone above. Key support is at 1.1050, situated in the demand zone
Baxia Markets (@baxiamarkets) 's Twitter Profile Photo

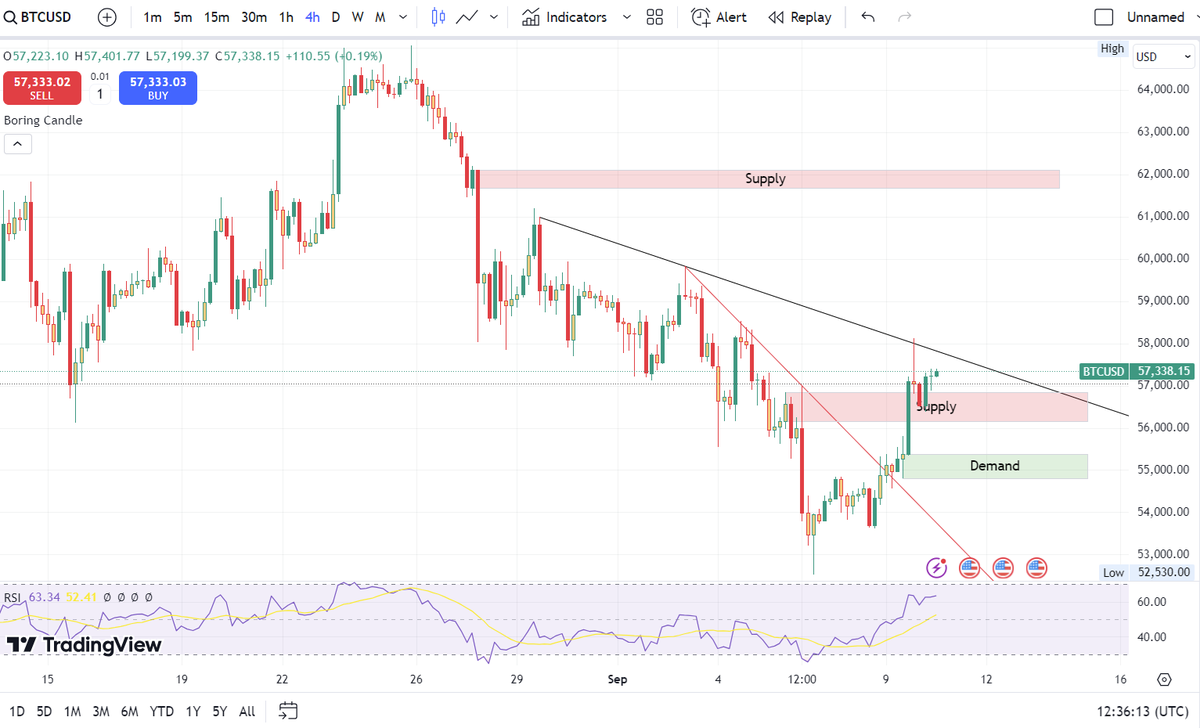
On the 4-hour chart, BTCUSD has successfully broken through both a steep downtrend line (red diagonal resistance) and a key supply zone. Currently, the price is approaching a descending trendline (black), which could serve as the next potential resistance. Should BTCUSD break

On the 4-hour chart, BTCUSD has successfully broken through both a steep downtrend line (red diagonal resistance) and a key supply zone. Currently, the price is approaching a descending trendline (black), which could serve as the next potential resistance. Should BTCUSD break
Baxia Markets (@baxiamarkets) 's Twitter Profile Photo

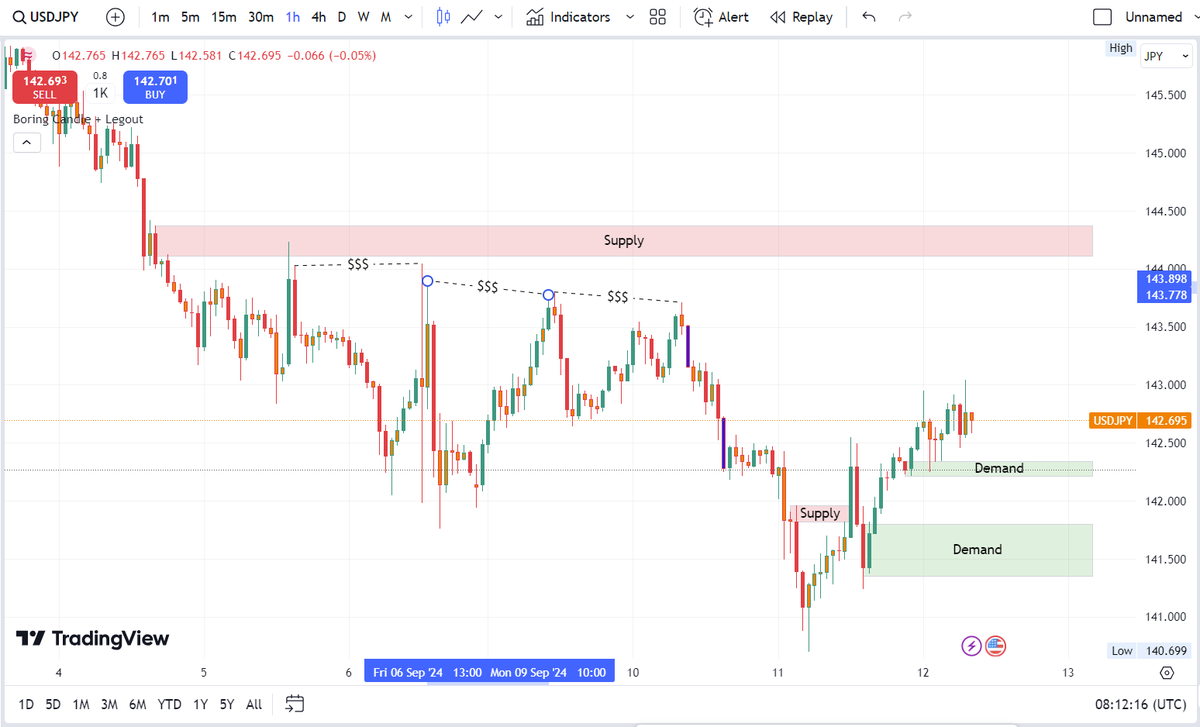
USDJPY has entered a bullish trend after breaking above the recent supply zone. The current key support level stands at 142.20, marking the highest demand zone. If bullish momentum persists, the next resistance (supply zone) lies above the liquidity or Equal Highs (EQH) at

USDJPY has entered a bullish trend after breaking above the recent supply zone. The current key support level stands at 142.20, marking the highest demand zone. If bullish momentum persists, the next resistance (supply zone) lies above the liquidity or Equal Highs (EQH) at
Baxia Markets (@baxiamarkets) 's Twitter Profile Photo

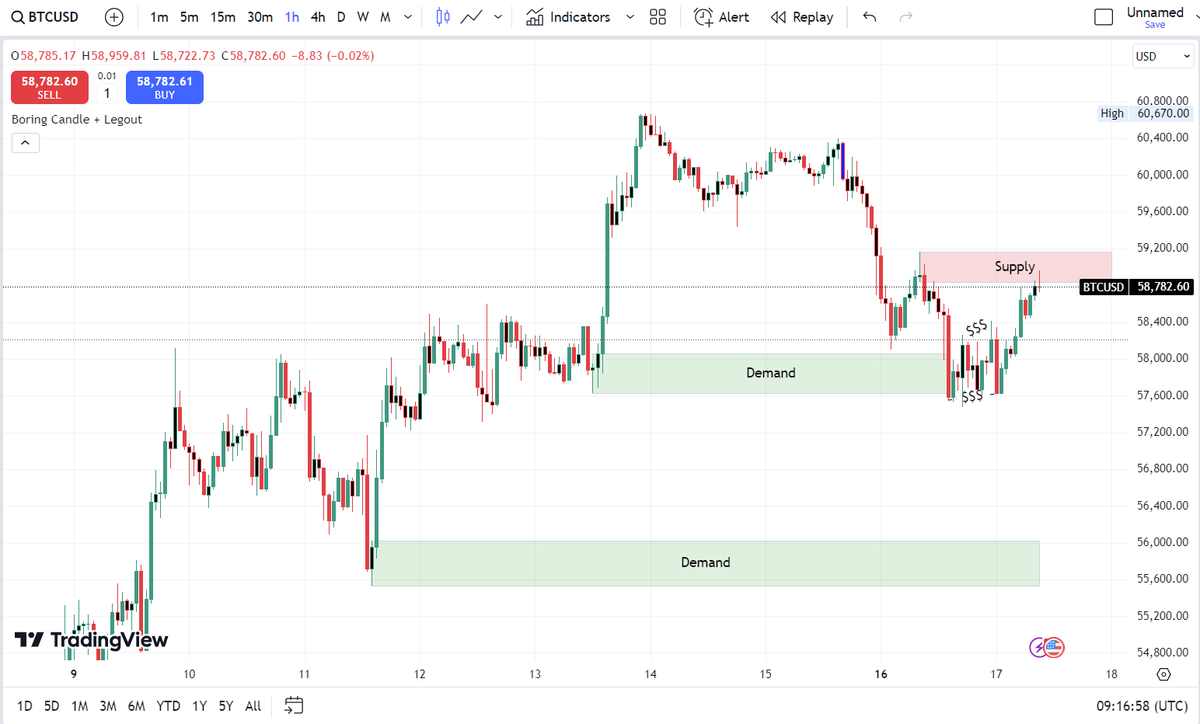
BTCUSD is currently entering a supply zone, which indicates a high likelihood of price reversal and continuation of the bearish trend. The next target for bears could be the demand zone around $55,000 - $56,000. A potential confirmation for the bearish reversal could be seen in

BTCUSD is currently entering a supply zone, which indicates a high likelihood of price reversal and continuation of the bearish trend. The next target for bears could be the demand zone around $55,000 - $56,000. A potential confirmation for the bearish reversal could be seen in
Baxia Markets (@baxiamarkets) 's Twitter Profile Photo

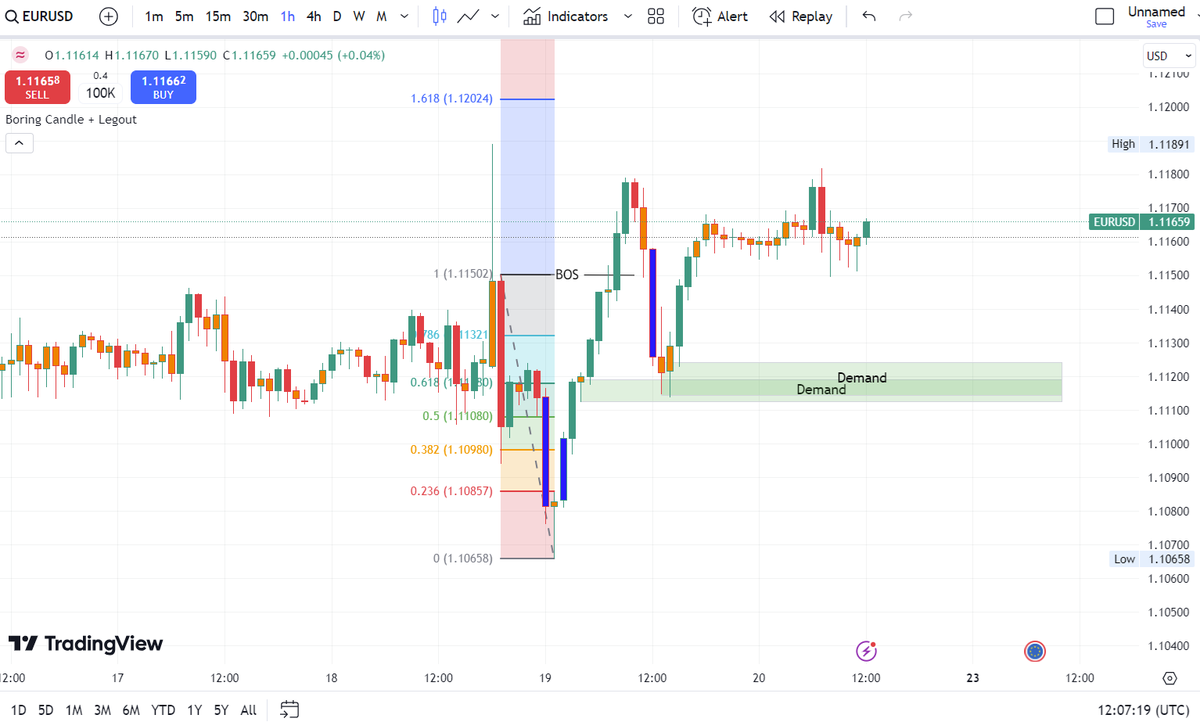
EURUSD recently experienced a pullback after a Break of Structure and is currently trading sideways, consolidating before its next move. Today, it's attempting to break above the new swing high 📈. Two critical demand/orderblock zones have formed around 1.1114, which are likely

EURUSD recently experienced a pullback after a Break of Structure and is currently trading sideways, consolidating before its next move. Today, it's attempting to break above the new swing high 📈. Two critical demand/orderblock zones have formed around 1.1114, which are likely