EurObserv_ER (@eurobserv_er) 's Twitter Profile
EurObserv_ER

@eurobserv_er

Free reports on #renewable energy in the European Union Member States.
Team: @Observ_ER, @renac_ag, @FraunhoferISI, @TNO_Research

ID: 498709282

linkhttp://www.eurobserv-er.org calendar_today21-02-2012 10:20:06

437 Tweet

2,2K Takipçi

3,3K Takip Edilen

Montel News (@montelnews) 's Twitter Profile Photo

Power generation from renewable sources in Europe hit a record high of more than 1,300 TWh in 2023 amid increased wind power capacity and decreasing demand, according to figures from @enappsys #renewables #windpower #wind #solar #solarenergy montelnews.com/news/1534919/e…

Power generation from renewable sources in Europe hit a record high of more than 1,300 TWh in 2023 amid increased wind power capacity and decreasing demand, according to figures from @enappsys 
#renewables #windpower #wind #solar #solarenergy
montelnews.com/news/1534919/e…
EurObserv_ER (@eurobserv_er) 's Twitter Profile Photo

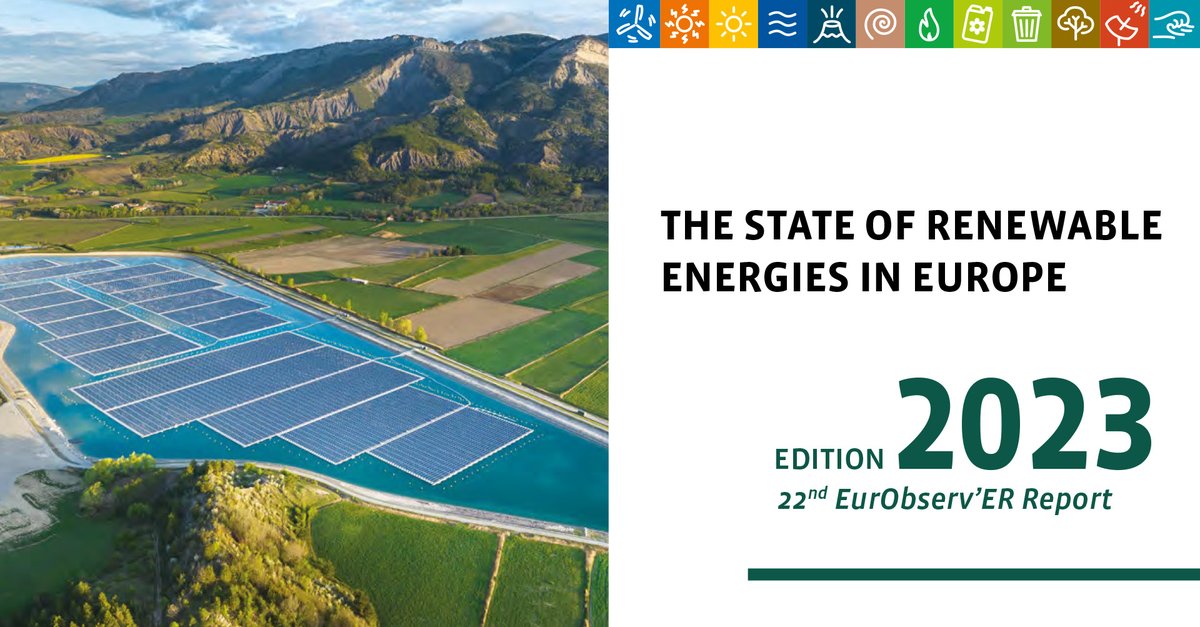
Just published: The 22nd edition of the State of #RenewableEnergy in the EU is out now! Offering a comprehensive overview at RES indicators and analysis for the EU and individual member states. #renewables #energytransition 🌍💡 Get your copy for free: bit.ly/48IaH0B

Just published: The 22nd edition of the State of #RenewableEnergy in the EU is out now! Offering a comprehensive overview at RES indicators and analysis for the EU and individual member states.  #renewables #energytransition 🌍💡 Get your copy for free: bit.ly/48IaH0B
EurObserv_ER (@eurobserv_er) 's Twitter Profile Photo

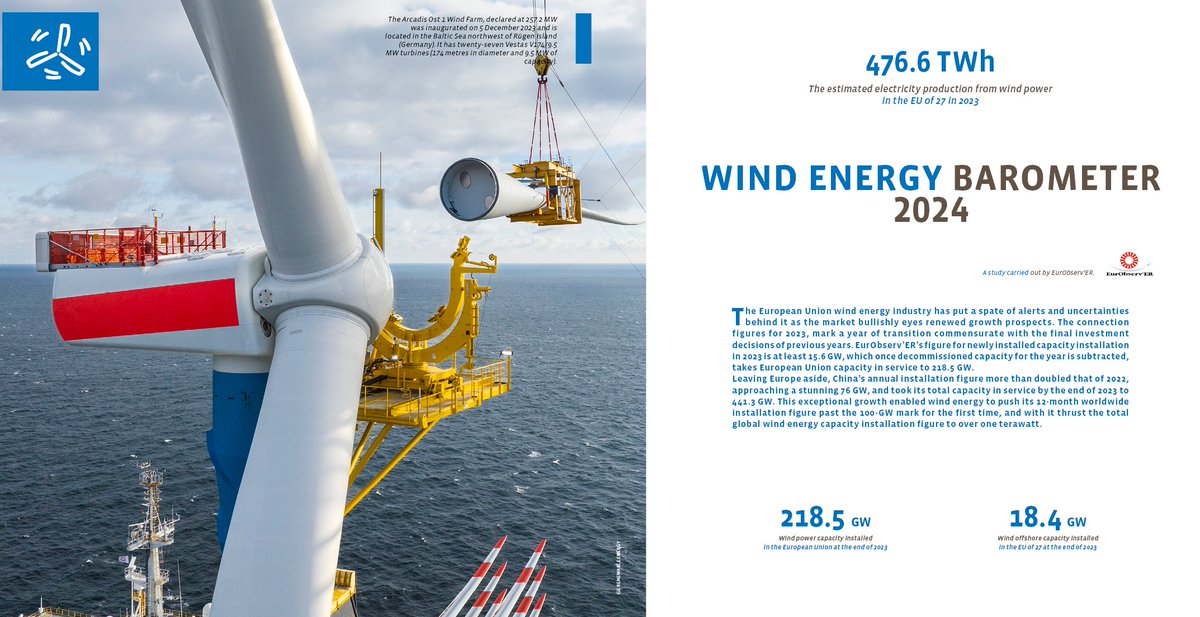
Electricity production from wind power in Europe rose to 477 Terrawatt hours in 2023. Enough energy to power e.g 120 million average European households for a year. This and more you can read in the just published Wind Energy Barometer: bit.ly/3Ut7mOV by #EurObserv'ER.

Electricity production from wind power in Europe rose to 477 Terrawatt hours in 2023. Enough energy to power e.g 120 million average European households for a year.
This and more you can read in the just published Wind Energy Barometer: bit.ly/3Ut7mOV by #EurObserv'ER.
EurObserv_ER (@eurobserv_er) 's Twitter Profile Photo

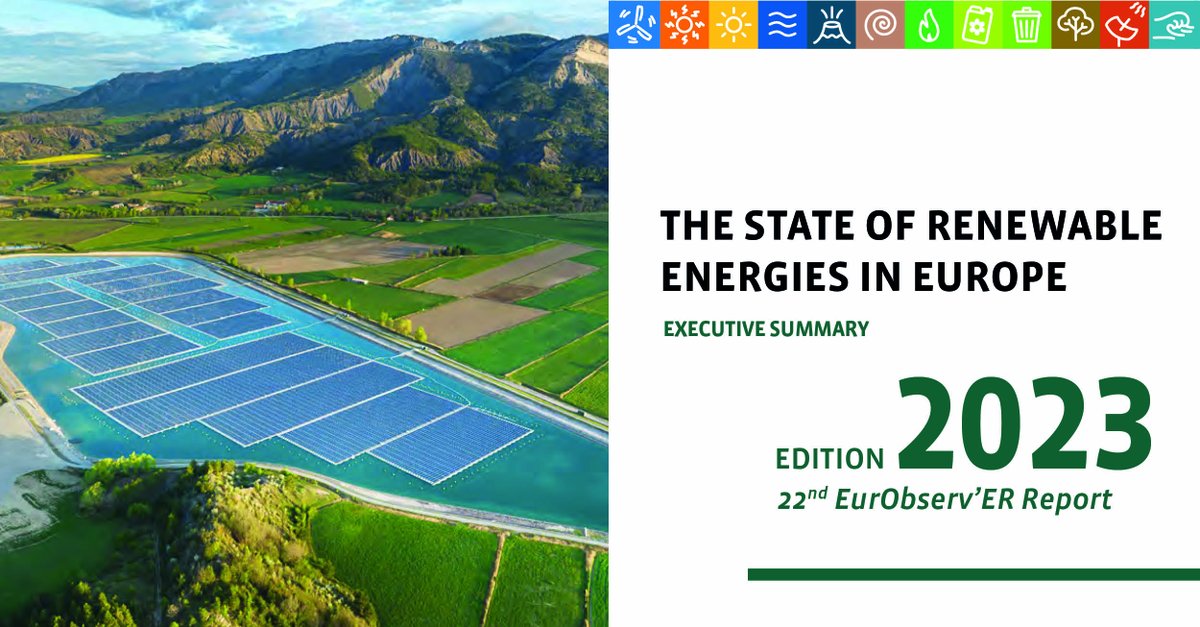
Did you know: solar power output increased by 28% across the #EU between 2021 and 2022 (46 TWh)? Discover latest insights on #RenewableEnergy in the Annual Overview Barometer Summary: 👉 bit.ly/48IaH0B Or visit our free webinar on April 25:👉 bit.ly/3U0X7QG

Did you know: solar power output
increased by 28% across the #EU between 2021 and 2022 (46 TWh)? Discover latest insights on #RenewableEnergy  in the Annual Overview Barometer Summary: 👉 bit.ly/48IaH0B

Or visit our free webinar on April 25:👉 bit.ly/3U0X7QG
EurObserv_ER (@eurobserv_er) 's Twitter Profile Photo

The front-runner in the expansion of European #windenergy in 2023 was #offshore systems: at least 2176 MW of grid-connected capacity was added last year (1020 MW in 2022). Visit ➡️ bit.ly/44fqALg for a free download of the Wind Energy Barometer.

EurObserv_ER (@eurobserv_er) 's Twitter Profile Photo

In our recent webinar, EurObserv_ER, Fraunhofer ISI, VITO and TNO Nieuws presented the latest developments on the State of #RenewableEnergies in Europe, Edition 2023. You can watch the complete 45-minutes webinar on Youtube now: youtube.com/watch?v=ZI6Ckn…
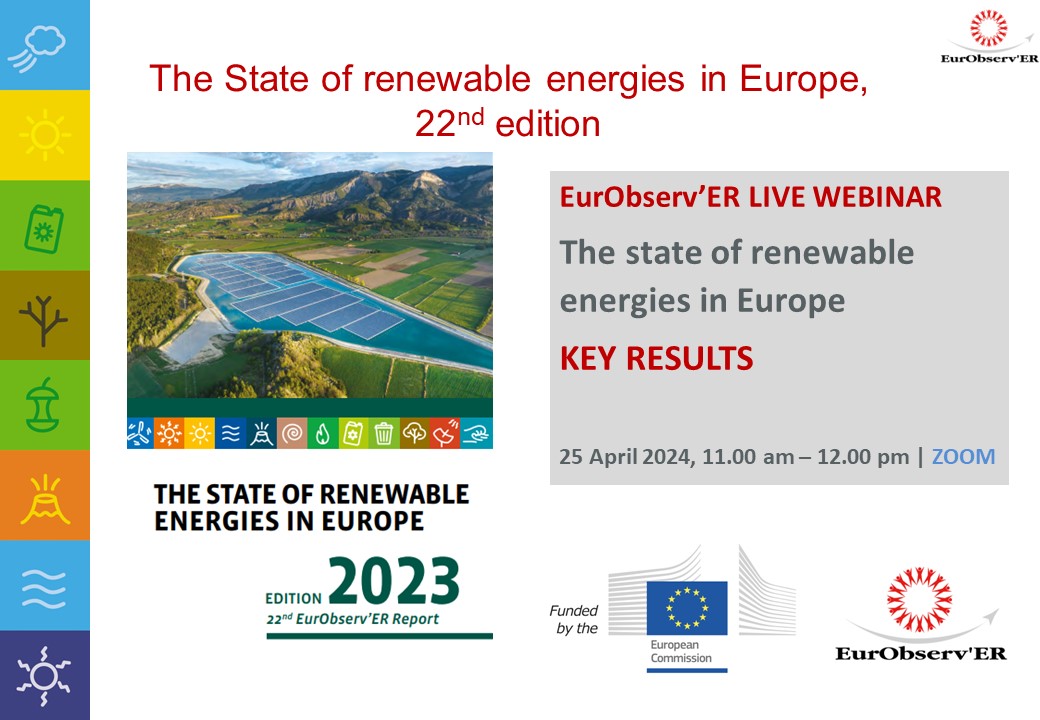
In our recent webinar, <a href="/EurObserv_ER/">EurObserv_ER</a>, <a href="/FraunhoferISI/">Fraunhofer ISI</a>, <a href="/VITObelgium/">VITO</a> and <a href="/TNO_nieuws/">TNO Nieuws</a> presented the latest developments  on the State of #RenewableEnergies in Europe, Edition 2023. 
You can watch the complete 45-minutes webinar on Youtube now: youtube.com/watch?v=ZI6Ckn…
EurObserv_ER (@eurobserv_er) 's Twitter Profile Photo

SolarPV had an outstanding year in 2023! The EU is the world's No.2 market with 53.1 GW capacity. 🌍 IRENA reports 345.5 GW installed globally, up from 199.1 GW in 2022. China led with 216.9 GW. Download the latest PV Barometer for free: 👉 bit.ly/3wN5ZSq #solarpower

EurObserv_ER (@eurobserv_er) 's Twitter Profile Photo

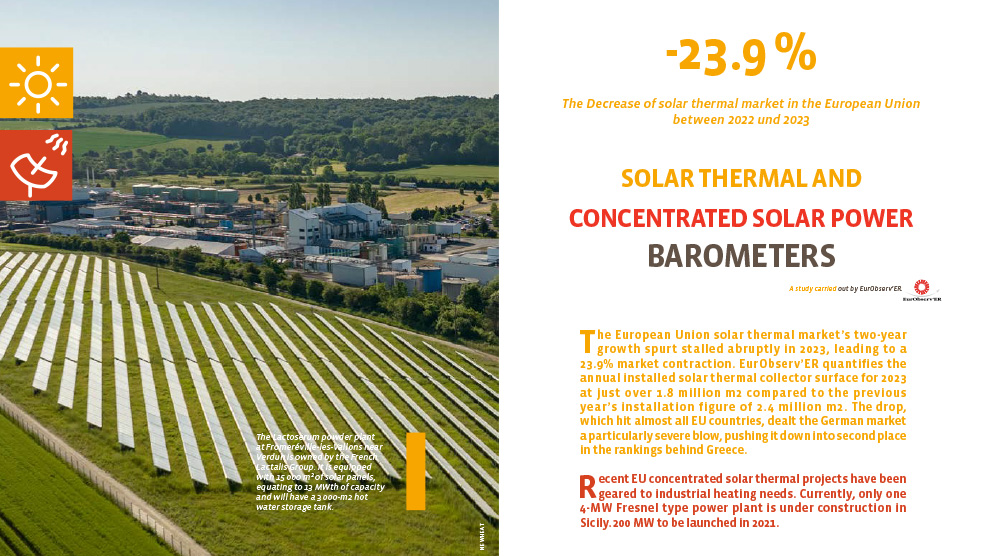
🌞 The EU solar thermal market faced a 23.9% decline in 2023, with Germany falling to second place. Greece shines, growing by 10% and leading the market. Despite setbacks, industrial projects show promise. Get the full baromer here: bit.ly/3A7NGbz #SolarThermal

🌞 The EU solar thermal market faced a 23.9% decline in 2023, with Germany falling to second place. Greece shines, growing by 10% and leading the market. Despite setbacks, industrial projects show promise. Get the full baromer here: bit.ly/3A7NGbz  
#SolarThermal
EurObserv_ER (@eurobserv_er) 's Twitter Profile Photo

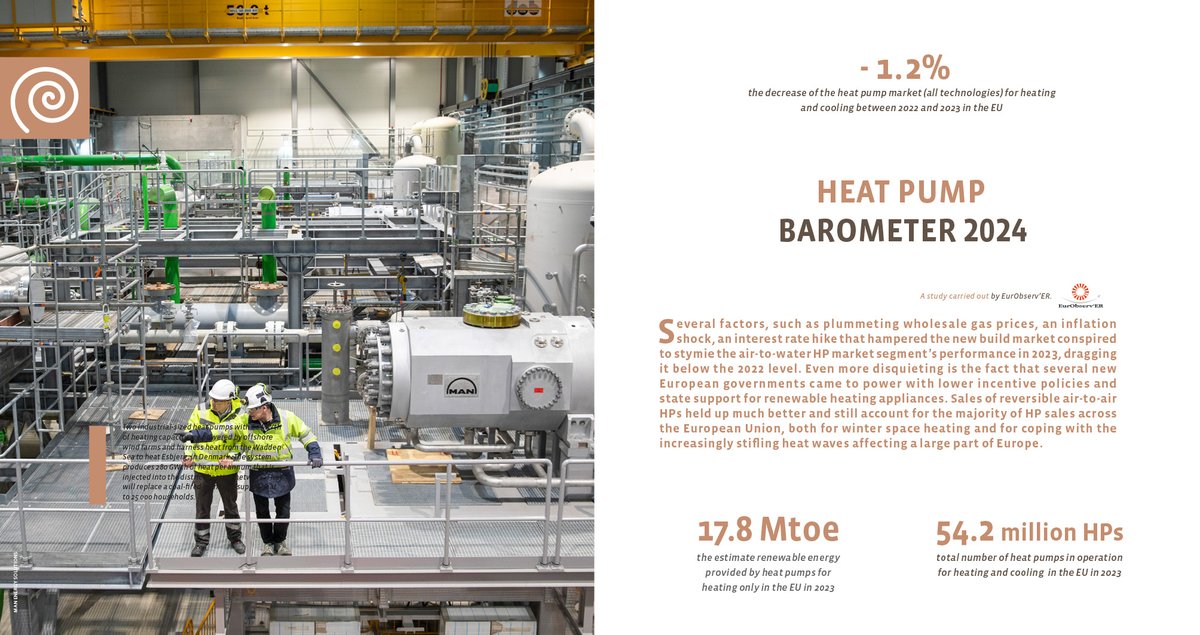
📉 EU heat pump market declined -1.2% (2022–2023) due to inflation, interest rates, & policy shifts. 🌍 Still, 54.2M HPs delivered 17.8 Mtoe of renewable heating energy in 2023! 📖 Download the free #HeatPump Barometer 2024: bit.ly/3OKXk8g #EnergyTransition #Renewables

📉 EU heat pump market declined -1.2% (2022–2023) due to inflation, interest rates, &amp; policy shifts. 🌍 Still, 54.2M HPs delivered 17.8 Mtoe of renewable heating energy in 2023!

📖 Download the free #HeatPump Barometer 2024: bit.ly/3OKXk8g

#EnergyTransition #Renewables
EurObserv_ER (@eurobserv_er) 's Twitter Profile Photo

Discover the latest insights on heat pumps in 2023! In the EU, 54.2 million heat pumps were in operation, contributing an estimated 17.8 Mtoe of renewable energy exclusively for heating. Download the latest #HeatPump Barometer for free: : 👉bit.ly/4g70u2a #Renewables

EurObserv_ER (@eurobserv_er) 's Twitter Profile Photo

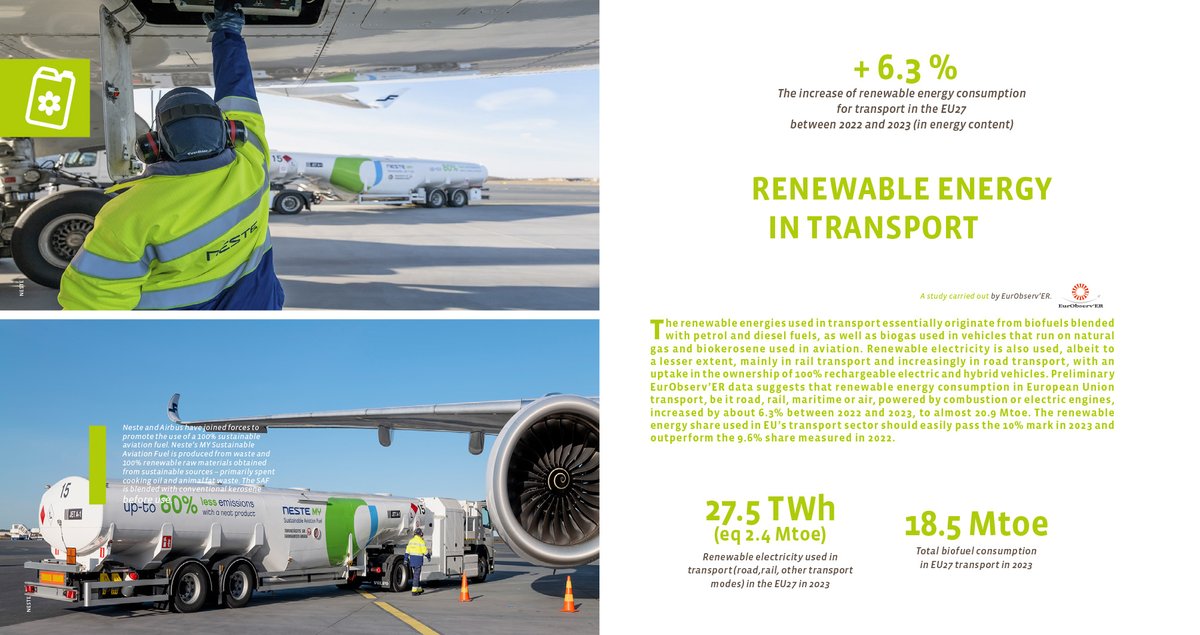
🚗Renewable energy consumption for transport in the EU27 grew by 6.3% (energy content) between 2022 and 2023. Total biofuel consumption reached 18.5 Mtoe in 2023.📊Download the Renewable Energy in Transport Barometer 2024 for the full analysis: bit.ly/3OXDGWJ #renewables

🚗Renewable energy consumption for transport in the EU27 grew by 6.3% (energy content) between 2022 and 2023. Total biofuel consumption reached 18.5 Mtoe in 2023.📊Download the Renewable Energy in Transport Barometer 2024 for the full analysis: bit.ly/3OXDGWJ #renewables
EurObserv_ER (@eurobserv_er) 's Twitter Profile Photo

Stay informed about renewable energy in the transport sector! The installation of over 800.000 charging stations in 2024 shows a clear rise of renewable electricity consumption in road transport. 📊Get the 2024 Transport Barometer: bit.ly/3OXDGWJ #EnergyTransition

EurObserv_ER (@eurobserv_er) 's Twitter Profile Photo

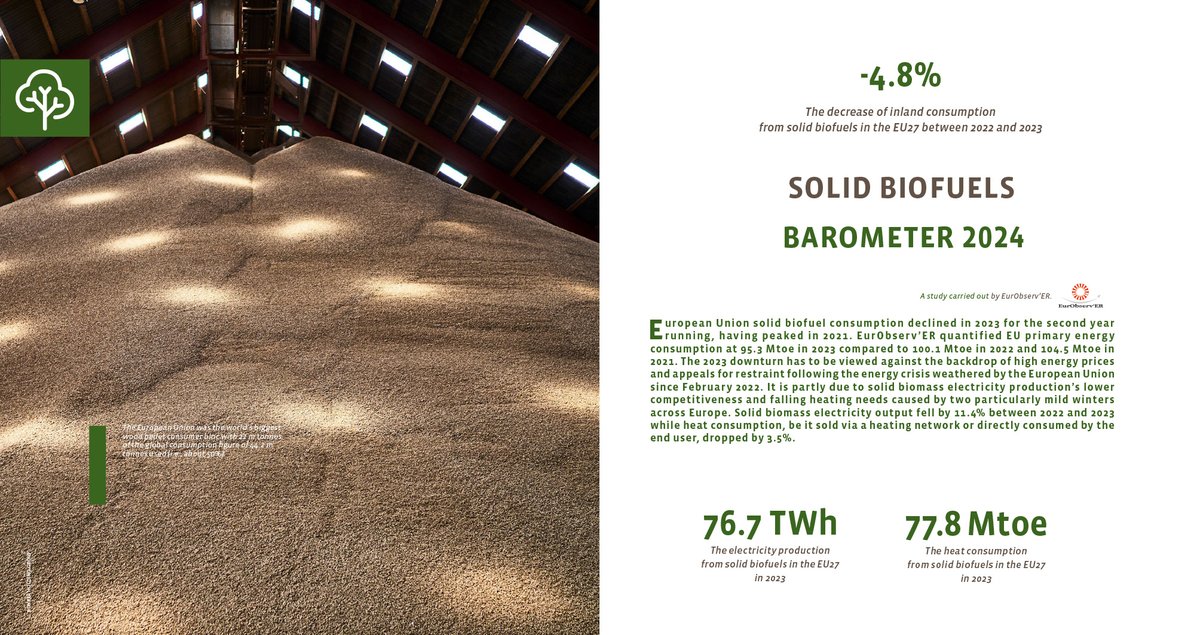
🔍 What’s driving the shift? Solid biofuel consumption in the EU27 fell by -4.8% in 2023, the 2nd consecutive year of decline. Discover the facts behind this in the latest EurObserv'ER report. 📉 📥 Download: bit.ly/40bh9Lg #RenewableEnergy #EnergyTrends

🔍 What’s driving the shift?
Solid biofuel consumption in the EU27 fell by -4.8% in 2023, the 2nd consecutive year of decline. Discover the facts behind this in the latest EurObserv'ER report. 📉
📥 Download: bit.ly/40bh9Lg

#RenewableEnergy  #EnergyTrends
EurObserv_ER (@eurobserv_er) 's Twitter Profile Photo

🔍 What’s behind the decline? In 2023, EU27 solid biofuel consumption dropped by -4.8%, the 2nd year of decline, due to high energy prices, post-2022 EU restraint, lower biomass competitiveness, and mild winters.📉 📥 Learn more: bit.ly/40bh9Lg #RenewableEnergy #Biofuels

EurObserv_ER (@eurobserv_er) 's Twitter Profile Photo

🔻 Decline! Solid biofuel use in the EU27 fell -4.8% in 2023—the 2nd year in a row. What’s driving the drop? Find out in the latest EurObserv'ER report. 📄 Download: bit.ly/40bh9Lg #RenewableEnergy #Biofuels #EnergyTrends

EurObserv_ER (@eurobserv_er) 's Twitter Profile Photo

🌍Want to learn from Europe’s leading research institutes in renewables? Join EurObserv_ER free live webinar hosted by @RENAC_GmbH with Observ’ER, TNO Research and Statistics of Netherlands , Fraunhofer ISI and VITO partners. 🗓️ Save your spot: bit.ly/3EyhWz2 #EnergyData
🌍Want to learn from Europe’s leading research institutes in renewables?
Join <a href="/EurObserv_ER/">EurObserv_ER</a> free live webinar hosted by @RENAC_GmbH with Observ’ER, <a href="/TNO_Research/">TNO Research</a> and <a href="/Statistic_NED/">Statistics of Netherlands</a> , <a href="/FraunhoferISI/">Fraunhofer ISI</a> and <a href="/VITObelgium/">VITO</a> partners.
🗓️ Save your spot: bit.ly/3EyhWz2
#EnergyData
EurObserv_ER (@eurobserv_er) 's Twitter Profile Photo

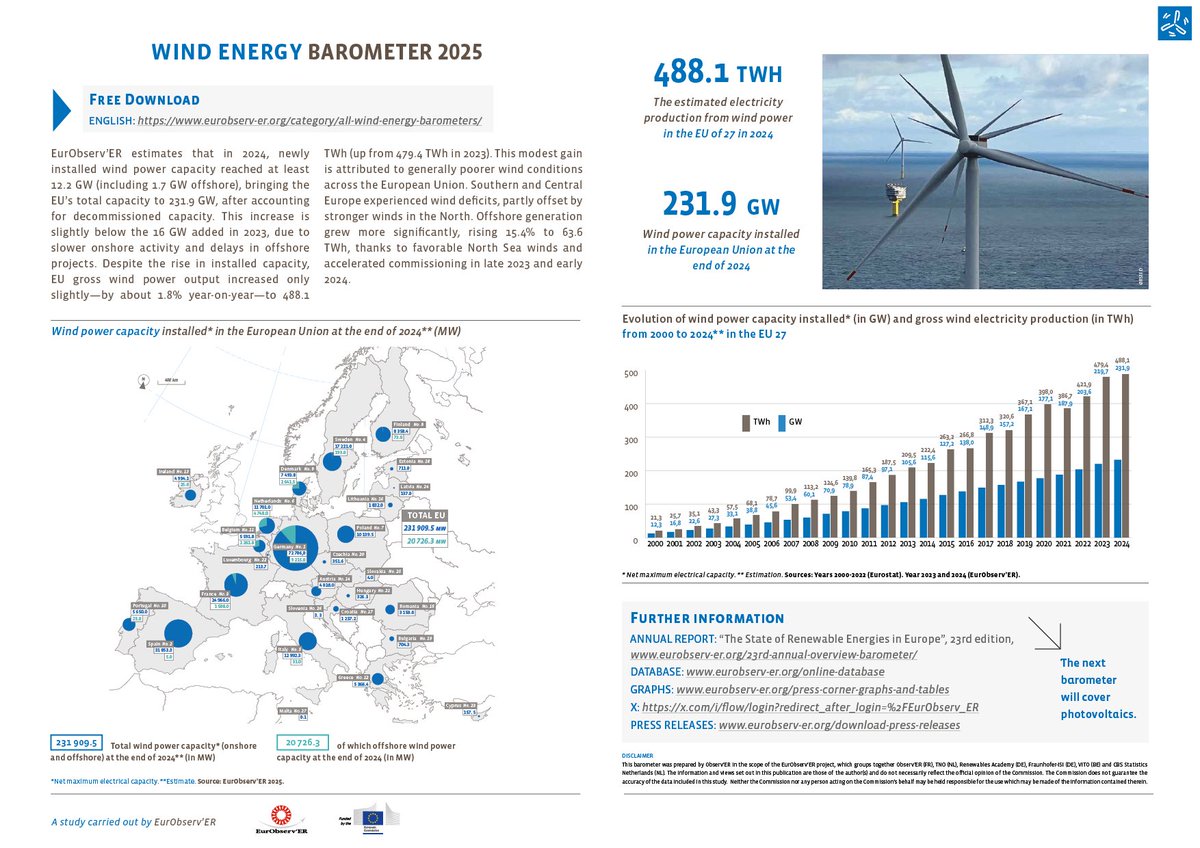
Wind energy = one of the EU’s strongest tools in the climate fight ⚡ 2024 numbers: ➡️231.9 GW wind turbine total capacity ➡️+12.2 GW increased ➡️1.7 GW offshore wind 📖Download the Wind Barometer: bit.ly/3RF0zQe #WindEnergy #EnergyData

EurObserv_ER (@eurobserv_er) 's Twitter Profile Photo

Wind power keeps expanding in Europe 🌬️ In 2024, the EU-27 generated 488.1 TWh from wind energy — and Germany leads the charge in installed capacity. Download the EU Wind Energy Barometer to learn the latest trends and stats 📊: bit.ly/3RF0zQe #WindEnergy #CleanPower

Wind power keeps expanding in Europe 🌬️
In 2024, the EU-27 generated 488.1 TWh from wind energy — and Germany leads the charge in installed capacity. 
Download the EU Wind Energy Barometer to learn the latest trends and stats 📊: bit.ly/3RF0zQe
#WindEnergy #CleanPower