Aakriti (@aakriticodes) 's Twitter Profile
Aakriti

@aakriticodes

ID: 1683741042515001349

calendar_today25-07-2023 07:29:02

73 Tweet

8 Takipçi

50 Takip Edilen

Aakriti (@aakriticodes) 's Twitter Profile Photo

#LSPPDay44 Today I practiced line plots using Seaborn: - Used relplot() with kind="line" - Tried plotting on different columns with the col option - Worked with the sample dots dataset Leapfrog Technology #60DaysOfLearning2025 #LearningWithLeapfrog

#LSPPDay44
Today I practiced line plots using Seaborn:
- Used relplot() with kind="line"
- Tried plotting on different columns with the col option
- Worked with the sample dots dataset
<a href="/lftechnology/">Leapfrog Technology</a>
#60DaysOfLearning2025 #LearningWithLeapfrog
Aakriti (@aakriticodes) 's Twitter Profile Photo

#LSPPDay45 Today I practiced line plots using relplot() in Seaborn: - Plotted trends over time - Used ci="sd" to show standard deviation - Explored visualizing multiple lines with different options Leapfrog Technology #60DaysOfLearning2025 #LearningWithLeapfrog

#LSPPDay45
Today I practiced line plots using relplot() in Seaborn:
- Plotted trends over time
- Used ci="sd" to show standard deviation
- Explored visualizing multiple lines with different options
<a href="/lftechnology/">Leapfrog Technology</a>
#60DaysOfLearning2025 #LearningWithLeapfrog
Aakriti (@aakriticodes) 's Twitter Profile Photo

#LSPPDay46 Today I explored sns.catplot() in Seaborn: - Used it to create bar and count plots - Learned to show/hide confidence intervals with ci=95 and ci=None - customized the plots for better visualization Leapfrog Technology #60DaysOfLearning2025 #LearningWithLeapfrog

#LSPPDay46
Today I explored sns.catplot() in Seaborn:
-  Used it to create bar and count plots
- Learned to show/hide confidence intervals with ci=95 and ci=None
- customized the plots for better visualization
<a href="/lftechnology/">Leapfrog Technology</a>
#60DaysOfLearning2025 #LearningWithLeapfrog
Aakriti (@aakriticodes) 's Twitter Profile Photo

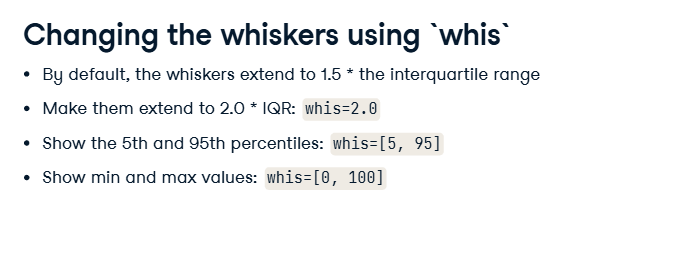
#LSPPDay47 Today I practiced creating box plots using sns.catplot() in Seaborn: - Customized category order - Hide outliers using sym="" - Adjusted whiskers with whis Leapfrog Technology #60DaysOfLearning2025 #LearningWithLeapfrog
#LSPPDay47
Today I practiced creating box plots using sns.catplot() in Seaborn:
- Customized category order
- Hide outliers using sym=""
- Adjusted whiskers with whis
<a href="/lftechnology/">Leapfrog Technology</a>
#60DaysOfLearning2025 #LearningWithLeapfrog
Aakriti (@aakriticodes) 's Twitter Profile Photo

#LSPPDay48 Today I practiced point plots using sns.catplot() in Seaborn: - Used estimator=median to show medians - Set ci=None to hide confidence intervals Used join=False to remove lines between points and hue for color Leapfrog Technology #60DaysOfLearning2025 #LearningWithLeapfrog

#LSPPDay48
Today I practiced point plots using sns.catplot() in Seaborn:
- Used estimator=median to show medians
- Set ci=None to hide confidence intervals
Used join=False to remove lines between points and hue for color
<a href="/lftechnology/">Leapfrog Technology</a> #60DaysOfLearning2025 #LearningWithLeapfrog
Aakriti (@aakriticodes) 's Twitter Profile Photo

#LSPPDay49 Today I customized Seaborn plots: - Changed plot styles with set_style() - Applied color schemes using set_palette() - Adjusted scale and text with set_context() Leapfrog Technology #60DaysOfLearning2025 #LearningWithLeapfrog

#LSPPDay49
Today I customized Seaborn plots:
- Changed plot styles with set_style()
- Applied color schemes using set_palette()
- Adjusted scale and text with set_context()
<a href="/lftechnology/">Leapfrog Technology</a>
#60DaysOfLearning2025 #LearningWithLeapfrog
Aakriti (@aakriticodes) 's Twitter Profile Photo

#LSPPDay50 Today I learned to customize Seaborn plots: - Used type(g) to understand plot type - Added a title with g.fig.suptitle() - Set axis labels with g.set(xlabel="", ylabel="") - Rotated using plt.xticks(rotation=90) Leapfrog Technology #60DaysOfLearning2025 #LearningWithLeapfrog

#LSPPDay50
Today I learned to customize Seaborn plots:
- Used type(g) to understand plot type
- Added a title with g.fig.suptitle()
- Set axis labels with g.set(xlabel="", ylabel="")
- Rotated using plt.xticks(rotation=90)
<a href="/lftechnology/">Leapfrog Technology</a> #60DaysOfLearning2025 #LearningWithLeapfrog
Aakriti (@aakriticodes) 's Twitter Profile Photo

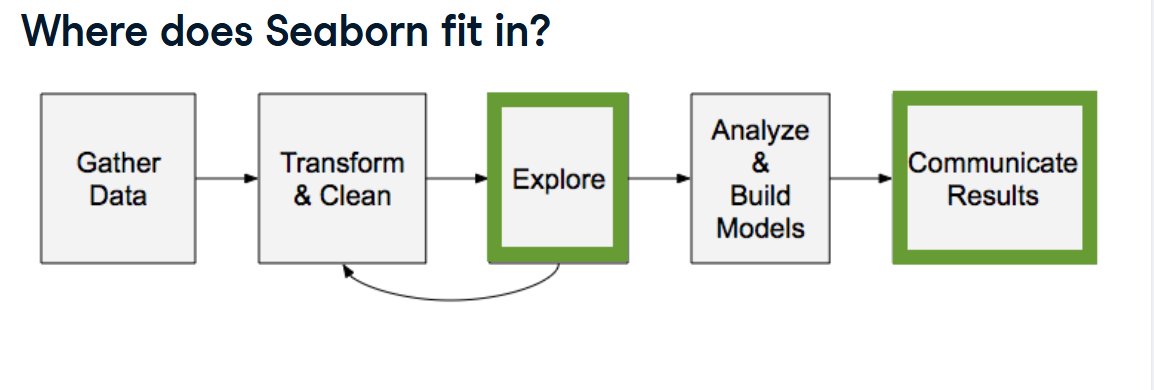
#LSPPDay51 Today I completed the Introduction to Seaborn course on DataCamp! - Practiced customizing plots (style, palette, context) - Learned to add titles, labels, and rotate tick marks - Got more familiar with Seaborn Leapfrog Technology #60DaysOfLearning2025 #LearningWithLeapfrog
#LSPPDay51
Today I completed the Introduction to Seaborn course on DataCamp!
- Practiced customizing plots (style, palette, context)
- Learned to add titles, labels, and rotate tick marks
- Got more familiar with Seaborn
<a href="/lftechnology/">Leapfrog Technology</a> #60DaysOfLearning2025 #LearningWithLeapfrog
Aakriti (@aakriticodes) 's Twitter Profile Photo

#LSPPDay52 Today I practiced Exploratory Data Analysis in Python: - Explored the dataset using .head() and .info() - Summarized key stats with .describe() and .value_counts() - Visualized data using sns.histplot() Leapfrog Technology #60DaysOfLearning2025 #LearningWithLeapfrog

#LSPPDay52
Today I practiced Exploratory Data Analysis in Python:
- Explored the dataset using .head() and .info()
- Summarized key stats with .describe() and .value_counts()
- Visualized data using sns.histplot()
<a href="/lftechnology/">Leapfrog Technology</a>
#60DaysOfLearning2025 #LearningWithLeapfrog
Aakriti (@aakriticodes) 's Twitter Profile Photo

#LSPPDay54 Today I continued the Intermediate Seaborn course: – Practiced sns.displot() for distribution plots and histograms – Learned about KDE, rug, and ECDF plots Leapfrog Technology #60DaysOfLearning2025 #LearningWithLeapfrog

#LSPPDay54
Today I continued the Intermediate Seaborn course:
– Practiced sns.displot() for distribution plots and histograms
– Learned about KDE, rug, and ECDF plots
<a href="/lftechnology/">Leapfrog Technology</a>
#60DaysOfLearning2025 #LearningWithLeapfrog
Aakriti (@aakriticodes) 's Twitter Profile Photo

#LSPPDay55 Today I learned about regression plots in Seaborn: - Used regplot() to draw regression lines - Tried lmplot() for grouped comparisons - Helped understand relationships between variables Leapfrog Technology #60DaysOfLearning2025 #LearningWithLeapfrog

#LSPPDay55
Today I learned about regression plots in Seaborn:
- Used regplot() to draw regression lines
- Tried lmplot() for grouped comparisons
- Helped understand relationships between variables
<a href="/lftechnology/">Leapfrog Technology</a>
#60DaysOfLearning2025 #LearningWithLeapfrog
Aakriti (@aakriticodes) 's Twitter Profile Photo

#LSPPDay56 Today I practiced customizing Seaborn plots: - Set plot styles using sns.set() and sns.set_style() - Compared themes like whitegrid, dark, etc. - Removed spines with sns.despine() for cleaner visuals Leapfrog Technology #60DaysOfLearning2025 #LearningWithLeapfrog

#LSPPDay56
Today I practiced customizing Seaborn plots:
- Set plot styles using sns.set() and sns.set_style()
- Compared themes like whitegrid, dark, etc.
- Removed spines with sns.despine() for cleaner visuals
<a href="/lftechnology/">Leapfrog Technology</a>
#60DaysOfLearning2025 #LearningWithLeapfrog
Aakriti (@aakriticodes) 's Twitter Profile Photo

#LSPPDay57 Today I continued with Intermediate Seaborn: - Used Matplotlib color codes in plots - Explored default & custom color palettes - Practiced set_palette() and palplot() Leapfrog Technology #60DaysOfLearning2025 #LearningWithLeapfrog

#LSPPDay57
Today I continued with Intermediate Seaborn:
- Used Matplotlib color codes in plots
- Explored default &amp; custom color palettes
- Practiced set_palette() and palplot()
<a href="/lftechnology/">Leapfrog Technology</a>
#60DaysOfLearning2025 #LearningWithLeapfrog
Aakriti (@aakriticodes) 's Twitter Profile Photo

#LSPPDay58 Today I practiced to customize Seaborn plots with Matplotlib: - Used fig, ax = plt.subplots() to create Axes - Passed ax to sns.histplot() - Set labels using ax.set() - Tried combining two plots side by side Leapfrog Technology #60DaysOfLearning2025 #LearningWithLeapfrog

#LSPPDay58
Today I practiced to customize Seaborn plots with Matplotlib:
- Used fig, ax = plt.subplots() to create Axes
- Passed ax to sns.histplot()
- Set labels using ax.set()
- Tried combining two plots  side by side
<a href="/lftechnology/">Leapfrog Technology</a>
#60DaysOfLearning2025 #LearningWithLeapfrog
Aakriti (@aakriticodes) 's Twitter Profile Photo

#LSPPDay59 Today I practiced categorical plots with Seaborn: -boxplot(), boxenplot() for abstract distributions -barplot(), pointplot() for statistical estimates -countplot() for category frequencies grouped by Region Leapfrog Technology #60DaysOfLearning2025 #LearningWithLeapfrog

#LSPPDay59
Today I practiced categorical plots with Seaborn: 
-boxplot(), boxenplot() for abstract distributions
-barplot(), pointplot() for statistical estimates
-countplot() for category frequencies grouped by Region
<a href="/lftechnology/">Leapfrog Technology</a> #60DaysOfLearning2025 #LearningWithLeapfrog
Aakriti (@aakriticodes) 's Twitter Profile Photo

Completed #60DaysOfLearning with #LearningWithLeapfrog It’s been a great experience helped me stay consistent and grow in my coding journey. -Learned Python, Pandas, NumPy, Matplotlib,Seaborn & EDA -Built a COVID-19 Data Visualization Project #CodingJourney #python Leapfrog Technology

Aakriti (@aakriticodes) 's Twitter Profile Photo

Day 1 of my #LaravelDocumentationJourney -Installed Laravel (PHP, Composer, NPM) -Created first app with laravel new -Learned SQLite default DB & migrations -Explored config files & .env setup Laravel = Progressive + Scalable + Community-driven 💡 #Laravel #PHP #WebDev