Alex J Bowers (@alex_j_bowers) 's Twitter Profile
Alex J Bowers

@alex_j_bowers

Professor of #EdLeadership @TeachersCollege @Columbia studying #EdResearch #EdAdmin w/ #DataScience #Bigdata #DataAnalytics. Affiliate @DataSciColumbia.

ID: 448120895

linkhttps://www.tc.columbia.edu/faculty/ab3764/ calendar_today27-12-2011 16:58:19

7,7K Tweet

1,1K Takipçi

1,1K Takip Edilen

Vanessa Echeverria (@vanechev) 's Twitter Profile Photo

🚀 #DS_LAK25 We’re excited to announce our workshop: AI-assisted Data Storytelling in Education! 📅 Join us at #LAK25 on Tuesday, March 4, 2025, in Dublin, Ireland. Learn more here: datastorytellingforeducation.org

Dan McNeish (@dmcneish18) 's Twitter Profile Photo

For anyone who might be interested in applying to PhD programs in quant methods this year, nearly all of the faculty in the Arizona State quant psyc program will be reviewing applications! More info on the program: psychology.asu.edu/degree/graduat…

For anyone who might be interested in applying to PhD programs in quant methods this year, nearly all of the faculty in the Arizona State quant psyc program will be reviewing applications!

More info on the program:
psychology.asu.edu/degree/graduat…
Ethan Mollick (@emollick) 's Twitter Profile Photo

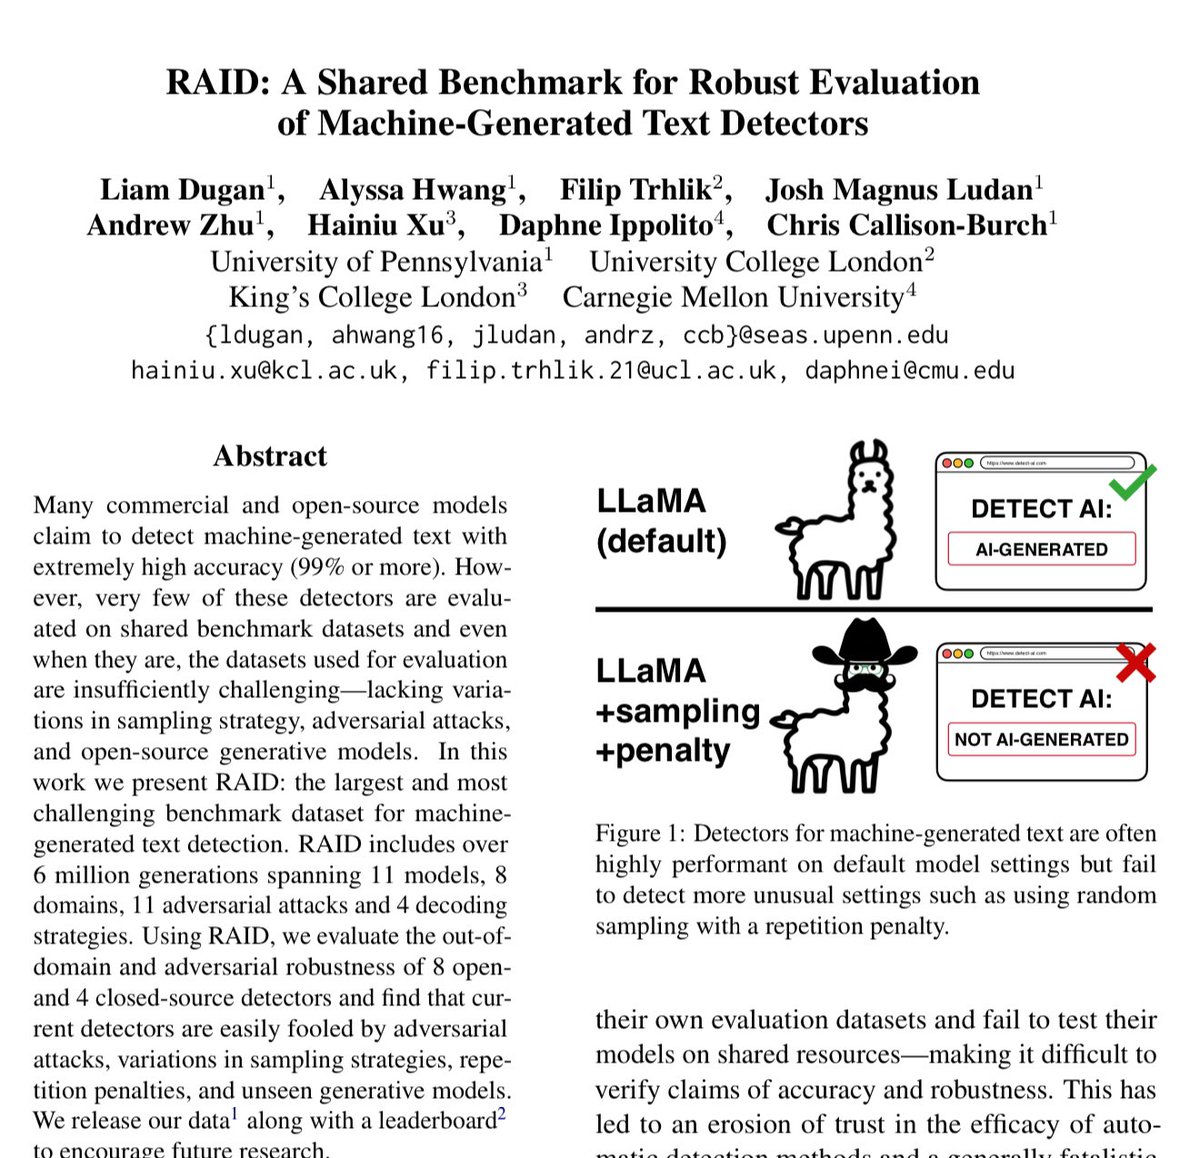
What percentage of students are you willing to falsely accuse of cheating with AI? There is a trade-off between that and detection rates for AI. At a 10% false positive rate, detectors find 80% or less of AI content. At a 1% rate most find 60% or less. Don’t trust AI detectors!

What percentage of students are you willing to falsely accuse of cheating with AI?

There is a trade-off between that and detection rates for AI. At a 10% false positive rate, detectors find 80% or less of AI content. At a 1% rate most find 60% or less.

Don’t trust AI detectors!
Joachim Schork (@joachimschork) 's Twitter Profile Photo

The "Grammar of Graphics" is a powerful concept that ggplot2 in R is built on. It breaks down the process of data visualization into layers, making it easier to customize and understand how to build effective charts. The image illustrates the essential layers used to create a

The "Grammar of Graphics" is a powerful concept that ggplot2 in R is built on. It breaks down the process of data visualization into layers, making it easier to customize and understand how to build effective charts.

The image illustrates the essential layers used to create a
Joachim Schork (@joachimschork) 's Twitter Profile Photo

I recently made a very popular LinkedIn post about Simpson's Paradox, which resulted in an engaging conversation. Paul Julian made a great comment on the relationship between Mixed Effects Models and Simpson's Paradox that I wanted to share with you. He pointed out that when

I recently made a very popular LinkedIn post about Simpson's Paradox, which resulted in an engaging conversation. Paul Julian made a great comment on the relationship between Mixed Effects Models and Simpson's Paradox that I wanted to share with you.

He pointed out that when
@emilymbender.bsky.social (@emilymbender) 's Twitter Profile Photo

As OpenAI and Meta introduce LLM-driven searchbots, I'd like to once again remind people that neither LLMs nor chatbots are good technology for information access. A thread, with links: >>

@emilymbender.bsky.social (@emilymbender) 's Twitter Profile Photo

Sunday's thread as a newsletter post, with replies to the most common types of counterarguments I encountered in my mentions. buttondown.com/maiht3k/archiv…

John Alexis Guerra Gómez @johnguerra.bsky.social (@duto_guerra) 's Twitter Profile Photo

What [Language, Database, Tools, ...] @stackoverflow users work with vs want to learn: 👉🏼 observablehq.com/@john-guerra/s… A quick Observable D3.js makeover of the chord diagram shared by Ari S. in our #dataviz class survey.stackoverflow.co/2024/technolog… Which one do you prefer?

What [Language, Database, Tools, ...] @stackoverflow users work with vs want to learn:

👉🏼 observablehq.com/@john-guerra/s…

A quick <a href="/observablehq/">Observable</a> <a href="/d3js_org/">D3.js</a> makeover of the chord diagram shared by <a href="/Ari_S_123/">Ari S.</a> in our #dataviz class
survey.stackoverflow.co/2024/technolog…

Which one do you prefer?
Joachim Schork (@joachimschork) 's Twitter Profile Photo

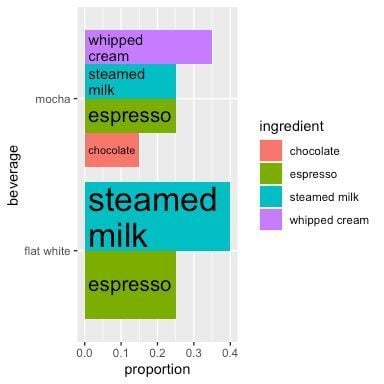
The ggfittext package is an extension of ggplot2 that simplifies the process of adjusting text within plots. It ensures that text labels fit within a specified area, enhancing the readability of your visualizations. ✔️ Flexible Text Resizing: ggfittext automatically adjusts text

The ggfittext package is an extension of ggplot2 that simplifies the process of adjusting text within plots. It ensures that text labels fit within a specified area, enhancing the readability of your visualizations.

✔️ Flexible Text Resizing: ggfittext automatically adjusts text
Yan Holtz (@r_graph_gallery) 's Twitter Profile Photo

Beautiful Data Art project 😍 Yesterday I discovered the work of Maayke Leenstra through the #30DayMapChallenge 🔥 Simply stunning I really need to give some love to my data-to-art.com project soon! Any other data art project I missed???

Beautiful Data Art project 😍

Yesterday I discovered the work of Maayke Leenstra through the #30DayMapChallenge

🔥 Simply stunning

I really need to  give some love to my data-to-art.com project soon!

Any other data art project I missed???
Dan McNeish (@dmcneish18) 's Twitter Profile Photo

This article gives a phenomenal overview of the history and evolution of best practices in measurement invariance and differential item functioning -- I can't remember the last time I learned so much from reading a single paper, highly recommended! tandfonline.com/doi/full/10.10…

Cole Knaflic (@storywithdata) 's Twitter Profile Photo

A well-designed graph will get the information across more quickly than a table. Learn more #dataviz lessons & see more makeovers at storytellingwithdata.com/makeovers

A well-designed graph will get the information across more quickly than a table. Learn more #dataviz lessons &amp; see more makeovers at storytellingwithdata.com/makeovers
Justin Skycak (@justinskycak) 's Twitter Profile Photo

The science of learning has advanced significantly over the past century. Numerous effective cognitive learning strategies have been identified and researched extensively since the early to mid-1900s, with key findings being successfully reproduced over and over again.

The science of learning has advanced significantly over the past century. Numerous effective cognitive learning strategies have been identified and researched extensively since the early to mid-1900s, with key findings being successfully reproduced over and over again.
Research Data Alliance (RDA) (@resdatall) 's Twitter Profile Photo

🔔Reminder The Call for Sessions for the 24th RDA Plenary (fully virtual) are open until 24 January 2025. RDA Members and Groups are encouraged to submit their proposals, under the theme of ‘Data for emerging technologies’. Learn more and submit: ow.ly/3xfA50UpXOJ

🔔Reminder

The Call for Sessions for the 24th RDA Plenary (fully virtual) are open until  24 January 2025.

RDA Members and Groups are encouraged to submit their proposals, under the theme of ‘Data for emerging technologies’.

Learn more and submit: ow.ly/3xfA50UpXOJ
Prof Lennart Nacke, PhD (@acagamic) 's Twitter Profile Photo

Your students aren't retaining the information you hoped? Focusing solely on knowledge transfer isn't working anymore. Every instructor knows Bloom's, but few use it right. Look at the progression: 1. Remembering: The foundation → Facts, terms, basic concepts → Building

Your students aren't retaining the information you hoped?

Focusing solely on knowledge transfer isn't working anymore.

Every instructor knows Bloom's, but few use it right.

Look at the progression:

1. Remembering: The foundation
→ Facts, terms, basic concepts
→ Building