Cat in the Hat ๐Ÿˆโ€โฌ› ๐ŸŽฉ ๐Ÿ‡ฌ๐Ÿ‡ง(@_CatintheHat) 's Twitter Profileg
Cat in the Hat ๐Ÿˆโ€โฌ› ๐ŸŽฉ ๐Ÿ‡ฌ๐Ÿ‡ง

@_CatintheHat

Mum โ€ข Lover of nature and clean, fresh air โ€ข Passionate about science โ€ข โ€œWithout data, youโ€™re just another person with an opinion.โ€

ID:1345136757591961607

calendar_today01-01-2021 22:36:17

16,7K Tweets

9,6K Followers

1,0K Following

Cat in the Hat ๐Ÿˆโ€โฌ› ๐ŸŽฉ ๐Ÿ‡ฌ๐Ÿ‡ง(@_CatintheHat) 's Twitter Profile Photo

๐Ÿ”ฅDr Rae Duncan (Rae) does not hold back in this thread.

She is angry.

Day in, day out, she sees first hand the impact that repeated Covid infections are having on our children.

If youโ€™re a parent, YOU should be angry too.

I know I am.

Our children deserve better.

account_circle
tern(@1goodtern) 's Twitter Profile Photo

If, before Covid, a cardiac care doctor saw 100 patients in a week, then Covid increased the number of people needing cardiac care, the doctor would still only be seeing 100 patients a week now.
Because the need has increased, but the doctor's time capacity hasn't.
See?

account_circle
Cat in the Hat ๐Ÿˆโ€โฌ› ๐ŸŽฉ ๐Ÿ‡ฌ๐Ÿ‡ง(@_CatintheHat) 's Twitter Profile Photo

Maria Van Kerkhove, World Health Organisation (Jan 2024):

โ€œ5 years from now,
10 years from now,
20 years from now,
what are we going
to see in terms of
CARDIAC impairment,
PULMONARY impairment,
NEUROLOGICAL impairment?'

This is an important message.

Are you paying attention?

account_circle
Cat in the Hat ๐Ÿˆโ€โฌ› ๐ŸŽฉ ๐Ÿ‡ฌ๐Ÿ‡ง(@_CatintheHat) 's Twitter Profile Photo

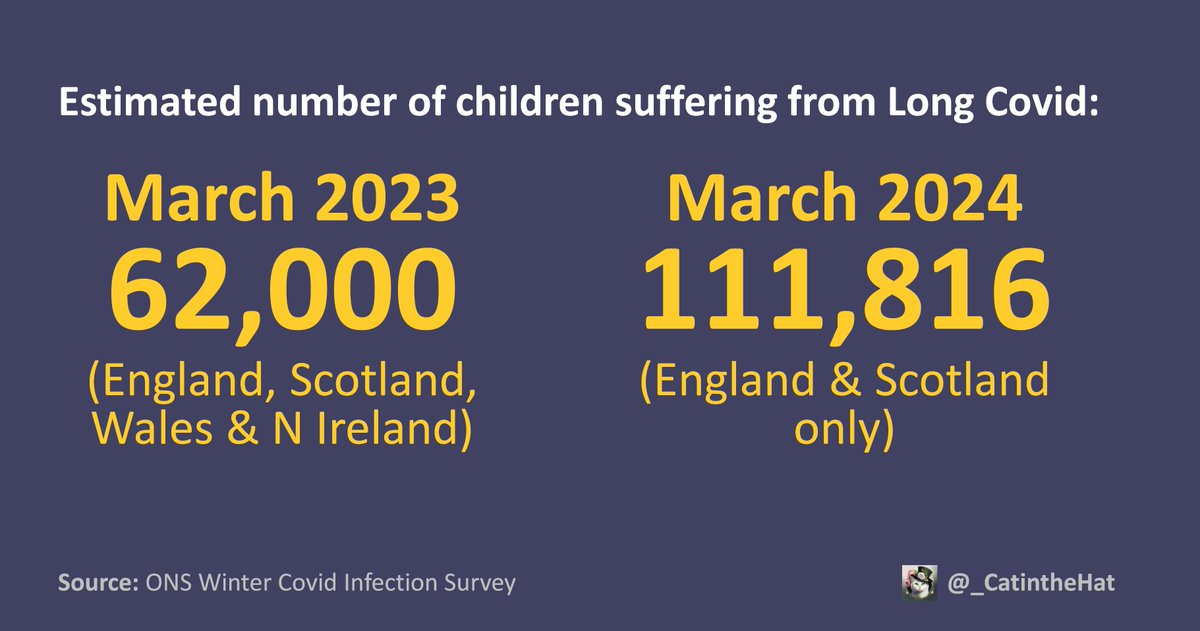
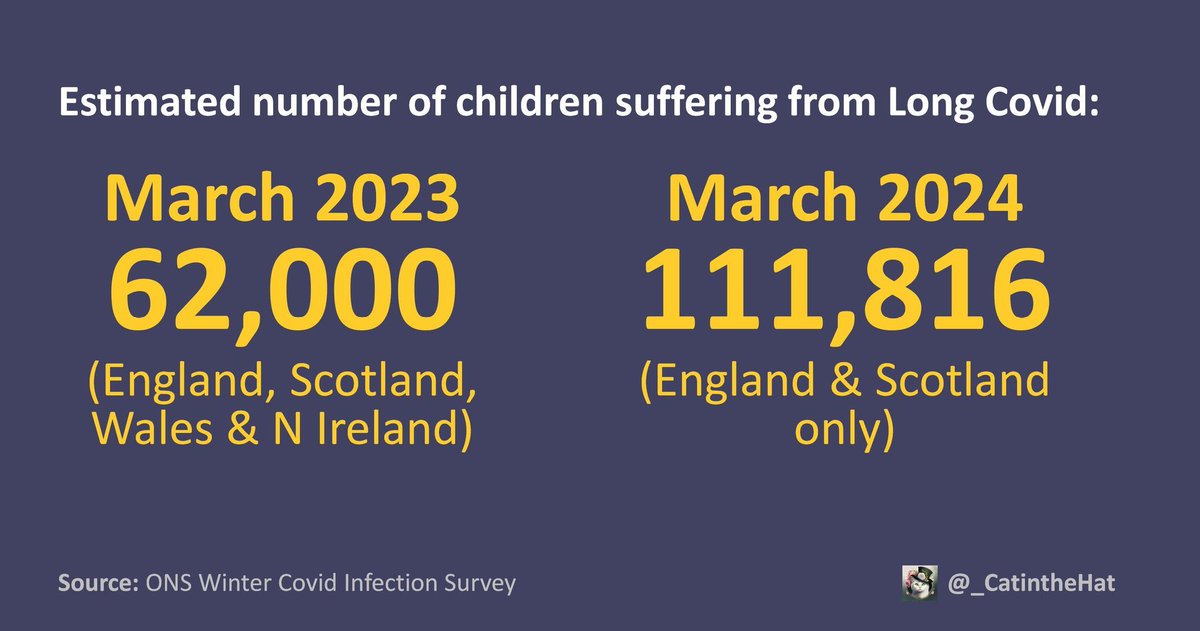
By popular request, hereโ€™s a new version of the 1st chart with March 2023 included.

Note: Data from March 2023 was UK data whereas the latest data is ๐Ÿด๓ ง๓ ข๓ ฅ๓ ฎ๓ ง๓ ฟ & ๐Ÿด๓ ง๓ ข๓ ณ๓ ฃ๓ ด๓ ฟ only. To present comparable data, Iโ€™ve extrapolated 92% of the UK-wide figures since ๐Ÿด๓ ง๓ ข๓ ฅ๓ ฎ๓ ง๓ ฟ & ๐Ÿด๓ ง๓ ข๓ ณ๓ ฃ๓ ด๓ ฟ represent 92% of the UK pop.

By popular request, hereโ€™s a new version of the 1st chart with March 2023 included. Note: Data from March 2023 was UK data whereas the latest data is ๐Ÿด๓ ง๓ ข๓ ฅ๓ ฎ๓ ง๓ ฟ & ๐Ÿด๓ ง๓ ข๓ ณ๓ ฃ๓ ด๓ ฟ only. To present comparable data, Iโ€™ve extrapolated 92% of the UK-wide figures since ๐Ÿด๓ ง๓ ข๓ ฅ๓ ฎ๓ ง๓ ฟ & ๐Ÿด๓ ง๓ ข๓ ณ๓ ฃ๓ ด๓ ฟ represent 92% of the UK pop.
account_circle
tern(@1goodtern) 's Twitter Profile Photo

Thank you to Cat in the Hat ๐Ÿˆโ€โฌ› ๐ŸŽฉ ๐Ÿ‡ฌ๐Ÿ‡ง for making this simple graphic to display the problem we have here in England.
We don't have a sicknote culture.
We have sick children.
The number of kids with Long Covid has nearly doubled in a year.
GOVERNMENT DATA:
Thank you to @_CatintheHat for making this simple graphic to display the problem we have here in England. We don't have a sicknote culture. We have sick children. The number of kids with Long Covid has nearly doubled in a year. GOVERNMENT DATA:
account_circle
crr(@crr7310) 's Twitter Profile Photo

Mark my words: we are entering another SARS2 wave. Iโ€™m an occupational physician trained to see patterns at work. Looks like 1st wave-large nos people coming to work with virus-rolling around in fits of coughing, faints/collapsing, grey with nausea.1/

account_circle
Pallavi Devulapalli(@doctorpallavi) 's Twitter Profile Photo

This graph captures in a nutshell, everything we can and should do to reduce infection and re-infection
in healthcare settings and mandate measures to keep C02 levels below 800ppm

So why are our leaders silent on this???
The BMA The RCN NHS England RCGP

account_circle
Cat in the Hat ๐Ÿˆโ€โฌ› ๐ŸŽฉ ๐Ÿ‡ฌ๐Ÿ‡ง(@_CatintheHat) 's Twitter Profile Photo

If the government is serious about wanting to address the school attendance crisis, then they need to be looking at ways to reduce the spread of illness in schools.

And that means telling sick kids to stay home and also improving VENTILATION & AIR FILTRATION in classrooms.

account_circle
Cat in the Hat ๐Ÿˆโ€โฌ› ๐ŸŽฉ ๐Ÿ‡ฌ๐Ÿ‡ง(@_CatintheHat) 's Twitter Profile Photo

And no, this is absolutely NOT normal.

Pre-pandemic, the average illness absence rate was about 2.5%.

Across the 2022/23 academic year, the illness absence rate was 3.7%.

Thatโ€™s nearly 50% higher than pre-pandemic!

โ€ฆand so far this academic year, itโ€™s STILL at 3.7%.

And no, this is absolutely NOT normal. Pre-pandemic, the average illness absence rate was about 2.5%. Across the 2022/23 academic year, the illness absence rate was 3.7%. Thatโ€™s nearly 50% higher than pre-pandemic! โ€ฆand so far this academic year, itโ€™s STILL at 3.7%.
account_circle
Cat in the Hat ๐Ÿˆโ€โฌ› ๐ŸŽฉ ๐Ÿ‡ฌ๐Ÿ‡ง(@_CatintheHat) 's Twitter Profile Photo

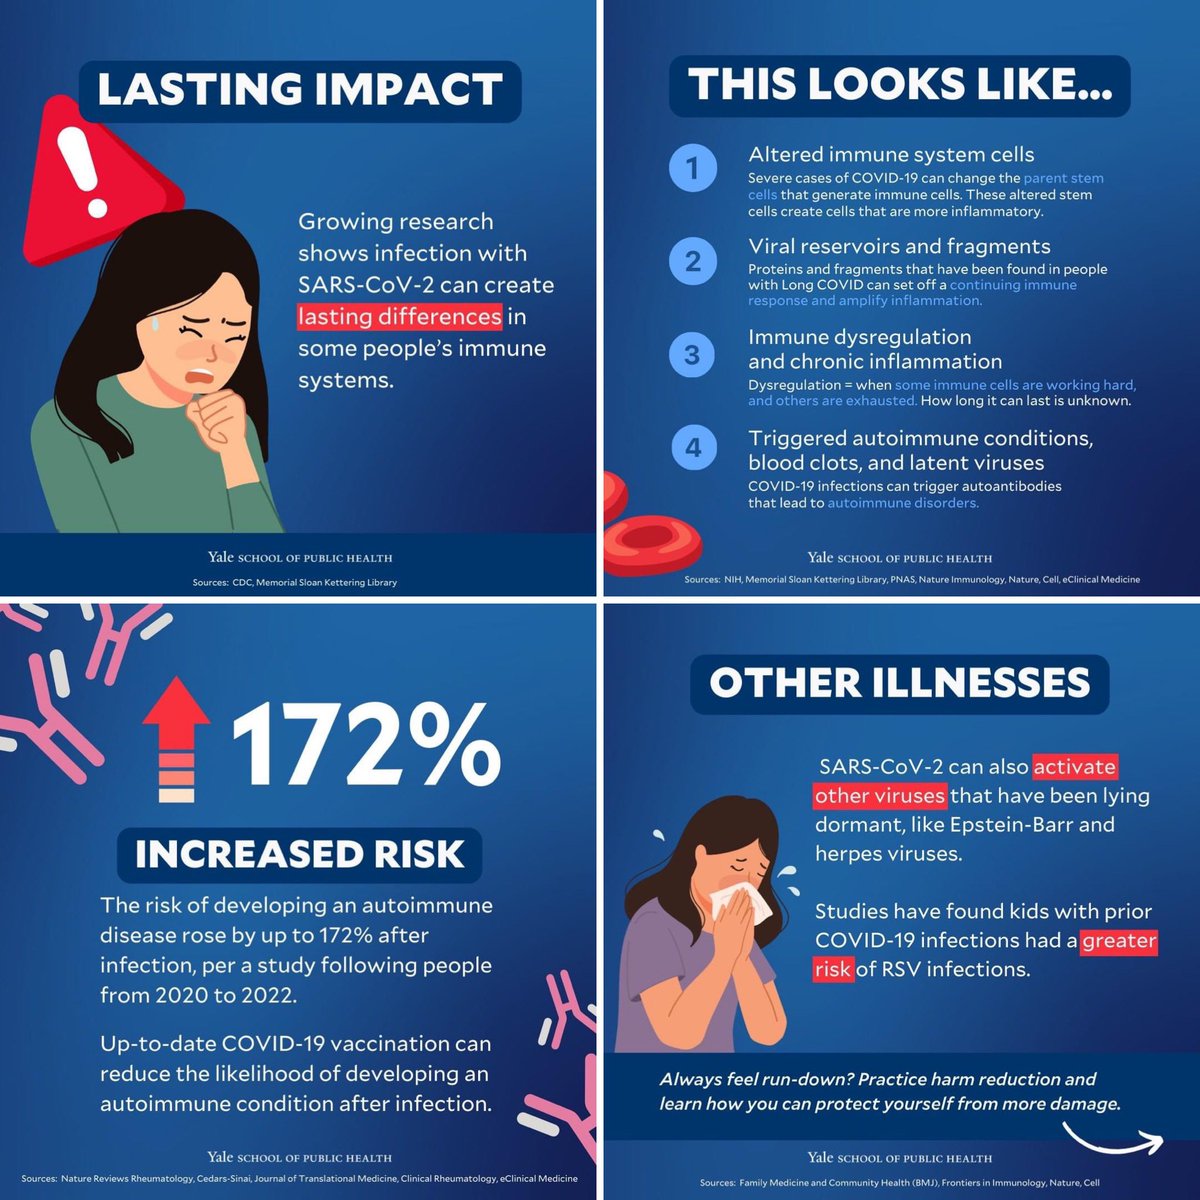
And then thereโ€™s the fact that the Covid infections themselves can create lasting differences in some people's immune systems which leaves them more susceptible to other diseases like RSV.

This may well be part of the reason weโ€™re seeing a rapid rise in so many other illnesses.

And then thereโ€™s the fact that the Covid infections themselves can create lasting differences in some people's immune systems which leaves them more susceptible to other diseases like RSV. This may well be part of the reason weโ€™re seeing a rapid rise in so many other illnesses.
account_circle
Cat in the Hat ๐Ÿˆโ€โฌ› ๐ŸŽฉ ๐Ÿ‡ฌ๐Ÿ‡ง(@_CatintheHat) 's Twitter Profile Photo

And yet, the governmentโ€™s latest attendance drive actively encourages parents to send sick children to school, unless they have a fever.

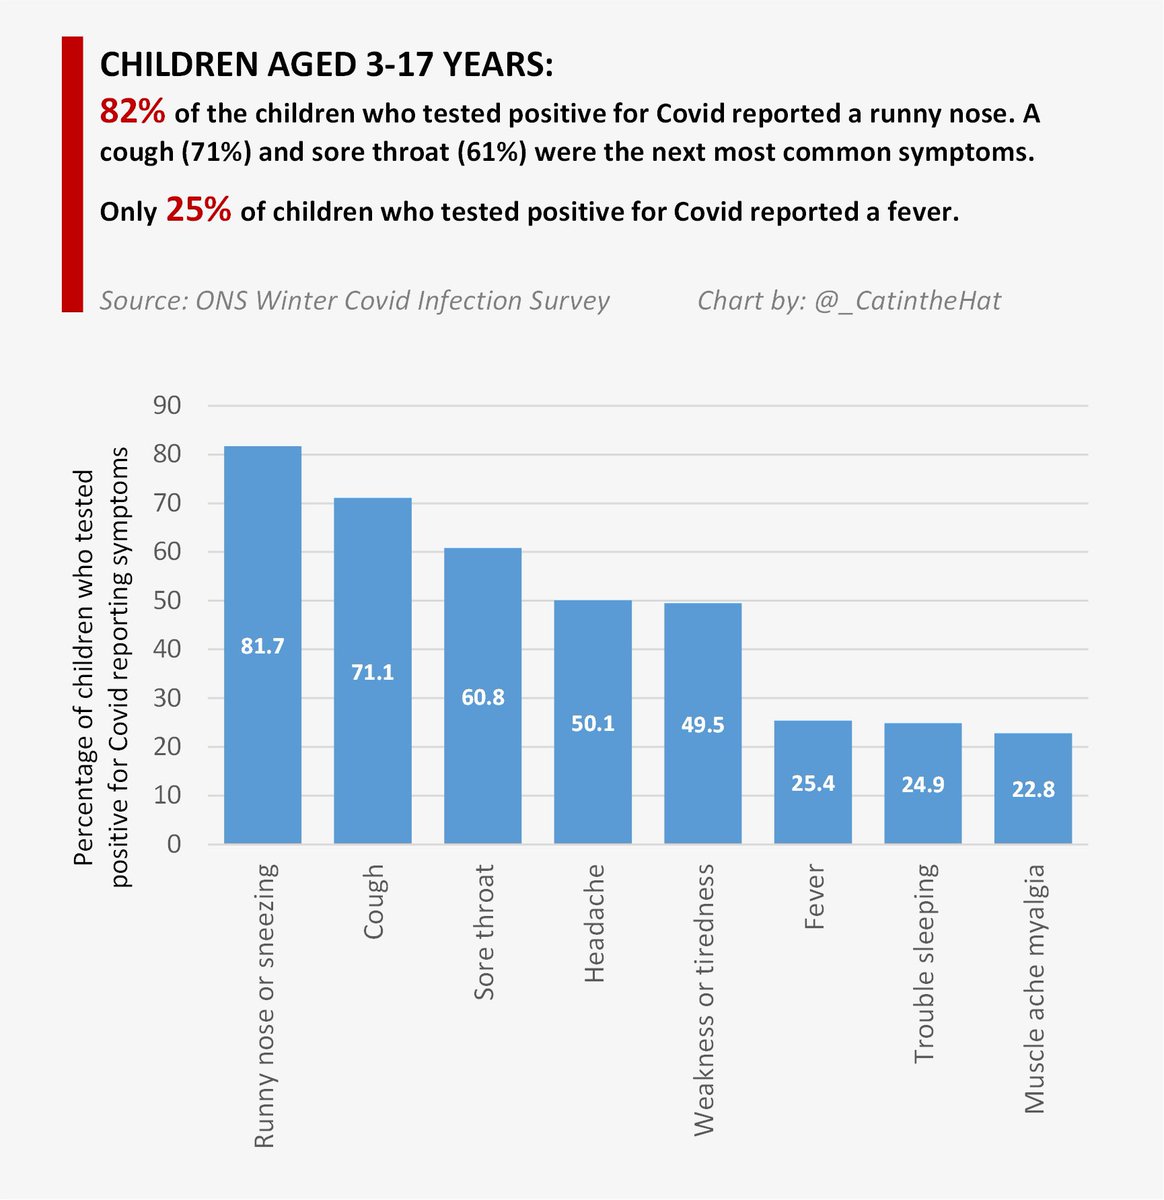
But, as the ONS data clearly shows, around 75% of children who are infectious with Covid will NOT have a fever!

And yet, the governmentโ€™s latest attendance drive actively encourages parents to send sick children to school, unless they have a fever. But, as the ONS data clearly shows, around 75% of children who are infectious with Covid will NOT have a fever!
account_circle
Cat in the Hat ๐Ÿˆโ€โฌ› ๐ŸŽฉ ๐Ÿ‡ฌ๐Ÿ‡ง(@_CatintheHat) 's Twitter Profile Photo

Another useful insight from the ONS data is prevalence of various symptoms amongst children who tested positive.

The most common symptoms for those with Covid were:
โ–ช๏ธrunny nose: 82%
โ–ช๏ธcough: 71%

Fever was far less common, reported in just 25% of children who tested positive.

Another useful insight from the ONS data is prevalence of various symptoms amongst children who tested positive. The most common symptoms for those with Covid were: โ–ช๏ธrunny nose: 82% โ–ช๏ธcough: 71% Fever was far less common, reported in just 25% of children who tested positive.
account_circle
Cat in the Hat ๐Ÿˆโ€โฌ› ๐ŸŽฉ ๐Ÿ‡ฌ๐Ÿ‡ง(@_CatintheHat) 's Twitter Profile Photo

The aspect Iโ€™m most concerned about is the long-term damage which Covid can cause to the brain.

We now know that Covid infection can lead to a plethora of new neurological symptoms, including confusion, difficulty concentrating, memory problems, depression & anxiety.

account_circle
Cat in the Hat ๐Ÿˆโ€โฌ› ๐ŸŽฉ ๐Ÿ‡ฌ๐Ÿ‡ง(@_CatintheHat) 's Twitter Profile Photo

Previous ONS studies have shown that children are JUST AS LIKELY to develop Long Covid after their 2nd infection as those infected for the 1st time.

Just because theyโ€™ve had Covid once & were fine, it doesnโ€™t mean theyโ€™ll be fine the next timeโ€ฆ

ons.gov.uk/peoplepopulatiโ€ฆ

Previous ONS studies have shown that children are JUST AS LIKELY to develop Long Covid after their 2nd infection as those infected for the 1st time. Just because theyโ€™ve had Covid once & were fine, it doesnโ€™t mean theyโ€™ll be fine the next timeโ€ฆ ons.gov.uk/peoplepopulatiโ€ฆ
account_circle
Cat in the Hat ๐Ÿˆโ€โฌ› ๐ŸŽฉ ๐Ÿ‡ฌ๐Ÿ‡ง(@_CatintheHat) 's Twitter Profile Photo

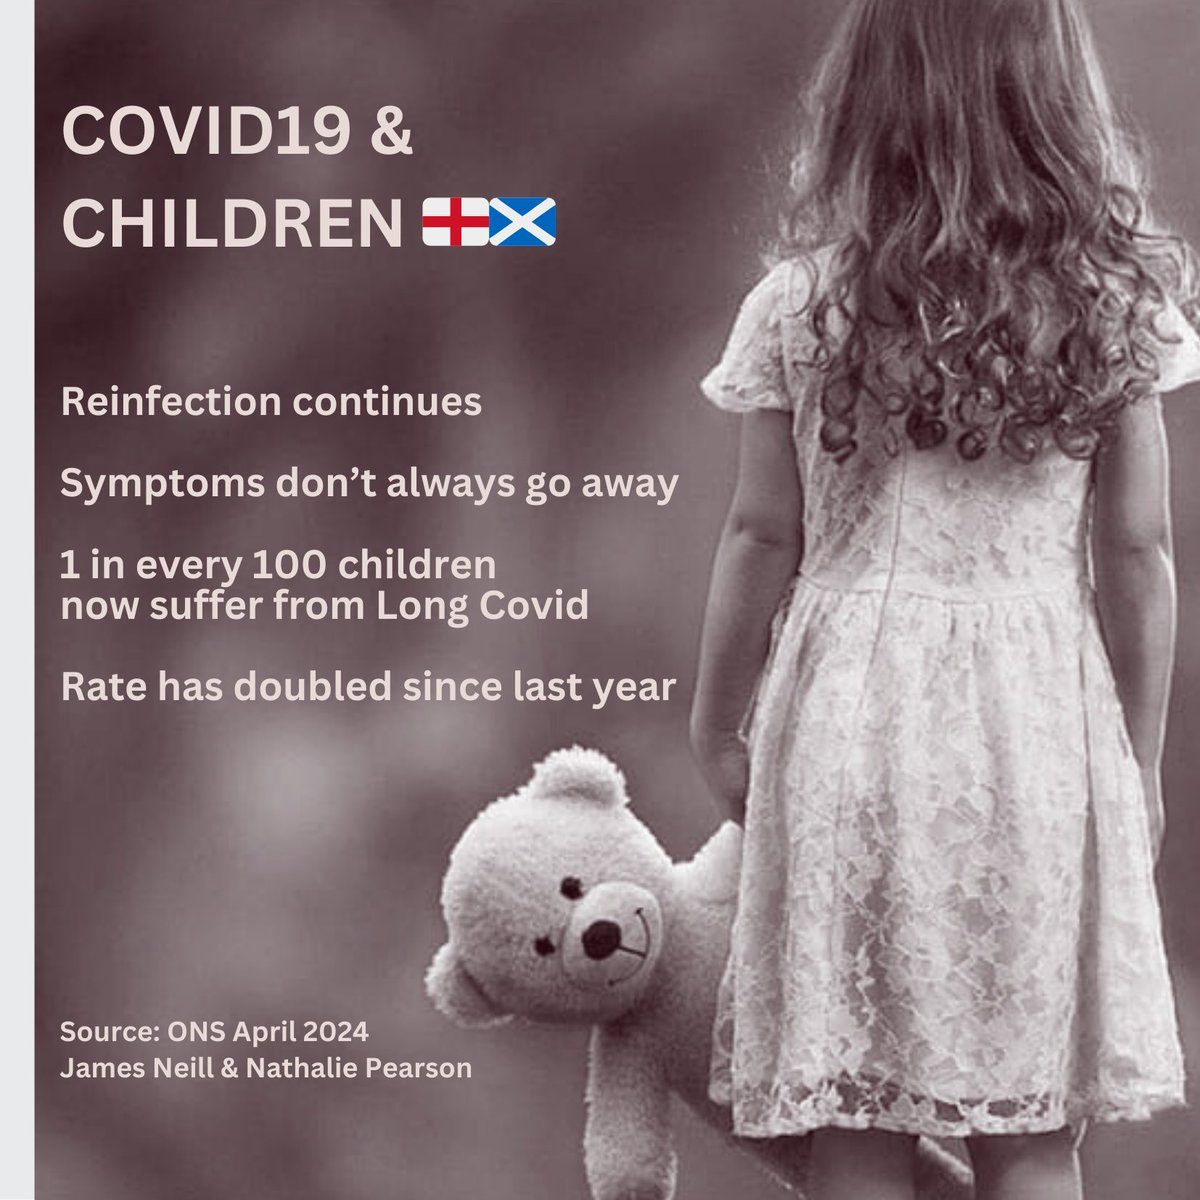
In fact, prevalence of Long Covid in children is now significantly higher than a year ago, in March 2023, when it was last reported.

At that time, 62,000 children were suffering from Long Covidโ€ฆ

โ€ฆ and that was UK-wide data whereas todayโ€™s new figures are for ๐Ÿด๓ ง๓ ข๓ ฅ๓ ฎ๓ ง๓ ฟ & ๐Ÿด๓ ง๓ ข๓ ณ๓ ฃ๓ ด๓ ฟ only.

In fact, prevalence of Long Covid in children is now significantly higher than a year ago, in March 2023, when it was last reported. At that time, 62,000 children were suffering from Long Covidโ€ฆ โ€ฆ and that was UK-wide data whereas todayโ€™s new figures are for ๐Ÿด๓ ง๓ ข๓ ฅ๓ ฎ๓ ง๓ ฟ & ๐Ÿด๓ ง๓ ข๓ ณ๓ ฃ๓ ด๓ ฟ only.
account_circle
Cat in the Hat ๐Ÿˆโ€โฌ› ๐ŸŽฉ ๐Ÿ‡ฌ๐Ÿ‡ง(@_CatintheHat) 's Twitter Profile Photo

One thing jumps out at me from this chart is:

โžก๏ธ 30% of people with Long Covid have been suffering for LESS than a year.

In other words, these are NEW cases that have arisen since the last ONS Long Covid report in March 2023.

One thing jumps out at me from this chart is: โžก๏ธ 30% of people with Long Covid have been suffering for LESS than a year. In other words, these are NEW cases that have arisen since the last ONS Long Covid report in March 2023.
account_circle
Cat in the Hat ๐Ÿˆโ€โฌ› ๐ŸŽฉ ๐Ÿ‡ฌ๐Ÿ‡ง(@_CatintheHat) 's Twitter Profile Photo

โ–ช๏ธ111,816 children (aged 3-17 yrs) were estimated to be suffering from Long Covid during the 4 week period ending 7 Mar 2024 (England & Scotland).

โ–ช๏ธOver 20,000 of these kids with Long Covid reported that their ability to undertake day-to-day activities had been limited A LOT.

โ–ช๏ธ111,816 children (aged 3-17 yrs) were estimated to be suffering from Long Covid during the 4 week period ending 7 Mar 2024 (England & Scotland). โ–ช๏ธOver 20,000 of these kids with Long Covid reported that their ability to undertake day-to-day activities had been limited A LOT.
account_circle