Variant Perception(@VrntPerception) 's Twitter Profileg
Variant Perception

@VrntPerception

Operating at the intersection of market history & data science, we believe man + machine beats man or machine alone.

ID:42688847

linkhttp://www.variantperception.com calendar_today26-05-2009 18:46:03

3,0K Tweets

23,9K Followers

477 Following

Variant Perception(@VrntPerception) 's Twitter Profile Photo

US homebuilders remain a key structural investment theme for us. We laid out our long-term bull thesis back in Sep 2021 in a VP Thematic Report noting a supply-demand mismatch of entry-level single-family housing.

account_circle
Variant Perception(@VrntPerception) 's Twitter Profile Photo

What are the structural limits of policy? Our recently published thematic report is a deep dive on how politics led the US to its current state of 'fiscal purgatory' and what history tells us is the most likely path forward to finance deficit spending.

account_circle
Variant Perception(@VrntPerception) 's Twitter Profile Photo

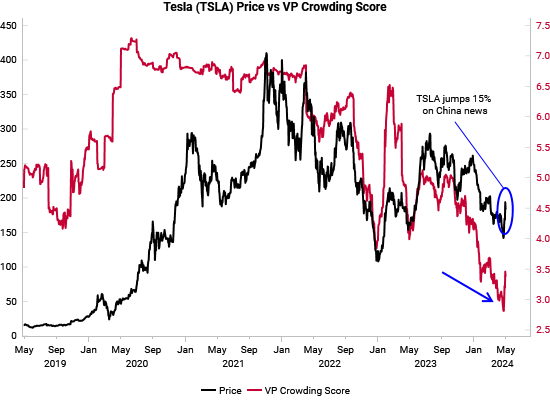
Recent price action in Tesla $TSLA is a great example of the typical behavior seen in uncrowded versus crowded stocks around key events.

Uncrowded stocks are often hurt less by bad news and benefit more from good news than their crowded counterparts.

Tesla's Crowding Score…

Recent price action in Tesla $TSLA is a great example of the typical behavior seen in uncrowded versus crowded stocks around key events. Uncrowded stocks are often hurt less by bad news and benefit more from good news than their crowded counterparts. Tesla's Crowding Score…
account_circle
Variant Perception(@VrntPerception) 's Twitter Profile Photo

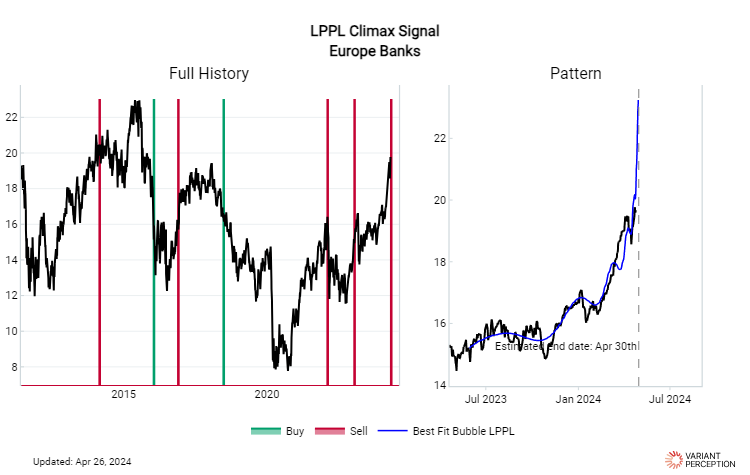
LPPL (log periodic power law) models are key behavioral models we use for trend exhaustion. European banks (EXV1 ETF) are experiencing an LPPL bubble climax, suggesting the uptrend is close to exhaustion

LPPL (log periodic power law) models are key behavioral models we use for trend exhaustion. European banks (EXV1 ETF) are experiencing an LPPL bubble climax, suggesting the uptrend is close to exhaustion
account_circle
Variant Perception(@VrntPerception) 's Twitter Profile Photo

The ratio of the total amount of G20 broad money supply (M2) to above ground gold stocks is a structural anchor for the direction of gold prices.

The stock of gold above ground only grows very slowly, at about 1-2% YoY. Money supply tends to materially outpace the growth in the…

The ratio of the total amount of G20 broad money supply (M2) to above ground gold stocks is a structural anchor for the direction of gold prices. The stock of gold above ground only grows very slowly, at about 1-2% YoY. Money supply tends to materially outpace the growth in the…
account_circle
Variant Perception(@VrntPerception) 's Twitter Profile Photo

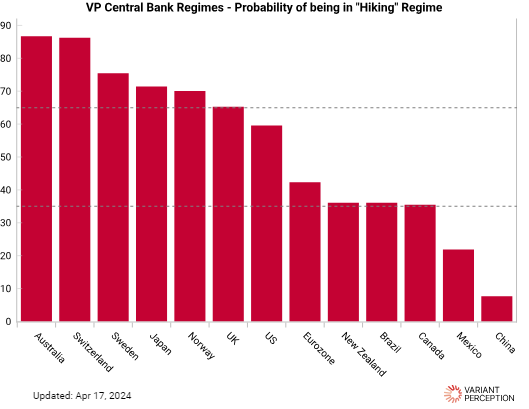
Our Central Bank Regime models use a combination of economic and market inputs to classify if a particular country's central bank is most likely in a 'hiking' or 'easing' regime.

Today, our models show the Reserve Bank of Australia as the most 'hawkish' and the PBOC as the most…

Our Central Bank Regime models use a combination of economic and market inputs to classify if a particular country's central bank is most likely in a 'hiking' or 'easing' regime. Today, our models show the Reserve Bank of Australia as the most 'hawkish' and the PBOC as the most…
account_circle
Variant Perception(@VrntPerception) 's Twitter Profile Photo

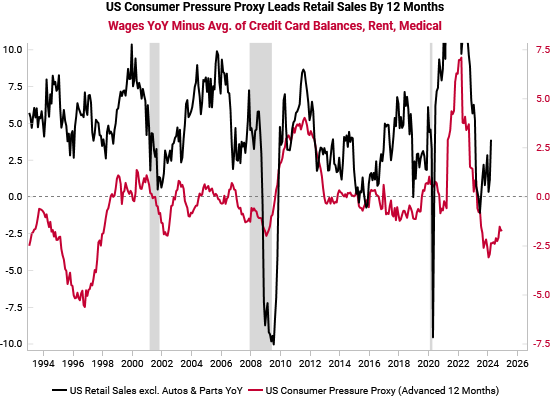
The easing of our US Consumer Pressure Proxy helps explain retail sales numbers and why consumers are still spending. The gap between nominal wage growth and growth in credit card, rent, and medical expenses is shrinking. Easing consumer pressures tend to lead retail sales by 12…

The easing of our US Consumer Pressure Proxy helps explain retail sales numbers and why consumers are still spending. The gap between nominal wage growth and growth in credit card, rent, and medical expenses is shrinking. Easing consumer pressures tend to lead retail sales by 12…
account_circle
Variant Perception(@VrntPerception) 's Twitter Profile Photo

Otavio (Tavi) Costa Capex trends are incorporated in our calculation of Capital Cycle scores, which remain high for commodities and energy globally.

@TaviCosta Capex trends are incorporated in our calculation of Capital Cycle scores, which remain high for commodities and energy globally.
account_circle
Variant Perception(@VrntPerception) 's Twitter Profile Photo

Capital cycles are powerful predictors of long-term equity returns: over-investment is a destroyer of capital and should be avoided, while capital-starved industries/regions consistently outperform.

We define capital scarcity by using three ratios: capex + R&D as % of assets,…

Capital cycles are powerful predictors of long-term equity returns: over-investment is a destroyer of capital and should be avoided, while capital-starved industries/regions consistently outperform. We define capital scarcity by using three ratios: capex + R&D as % of assets,…
account_circle