Realtor.com Economics(@RDC_Economics) 's Twitter Profileg
Realtor.com Economics

@RDC_Economics

@realtordotcom Econ team. Expert insights on #housing, #economy, & #realestate + updates on the latest https://t.co/ZwCRkomjF2 data for consumers & professionals.

ID:986455765799096321

linkhttps://www.realtor.com/research calendar_today18-04-2018 04:05:56

8,8K Tweets

5,9K Followers

253 Following

Realtor.com Economics(@RDC_Economics) 's Twitter Profile Photo

With energy costs rising in today's CPI, including for gasoline, which is now up 5.6% in just 2 months, will electric vehicles (EVs) get another look from consumers? We'll see. In the meanwhile, we've identified the most EV-friendly housing markets: realtor.com/research/elect…

account_circle
Realtor.com Economics(@RDC_Economics) 's Twitter Profile Photo

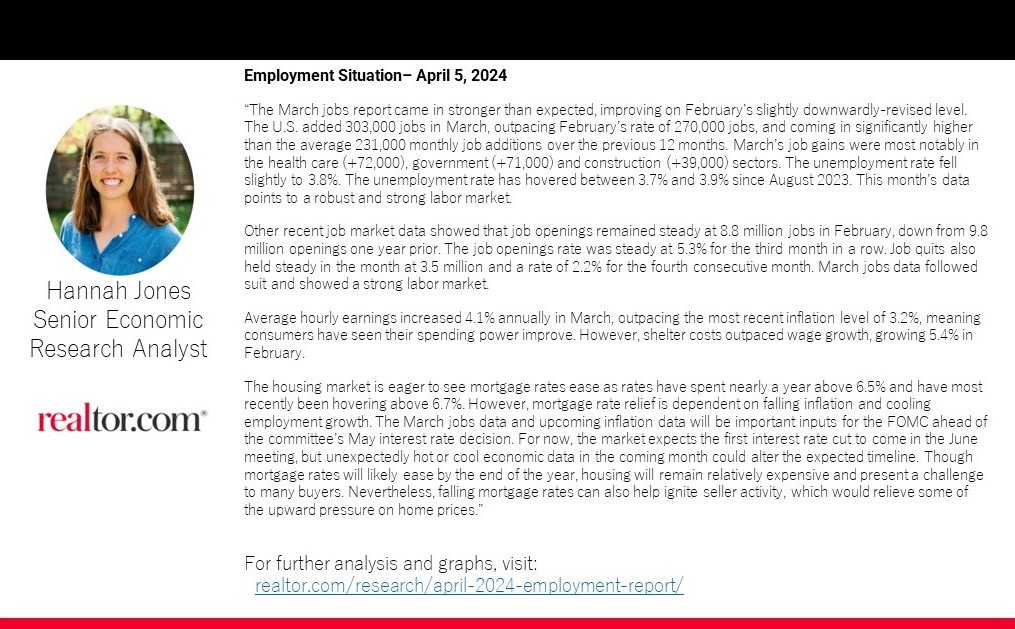
Today's CPI was higher than hoped for as rising energy and shelter costs continue to push prices higher. In key categories, inflation tied or exceeded last month's readings. Fed rate cuts are going to be slower, and that means upward pressure on rates. realtor.com/research/cpi-i…

Today's CPI was higher than hoped for as rising energy and shelter costs continue to push prices higher. In key categories, inflation tied or exceeded last month's readings. Fed rate cuts are going to be slower, and that means upward pressure on rates. realtor.com/research/cpi-i…
account_circle
Realtor.com Economics(@RDC_Economics) 's Twitter Profile Photo

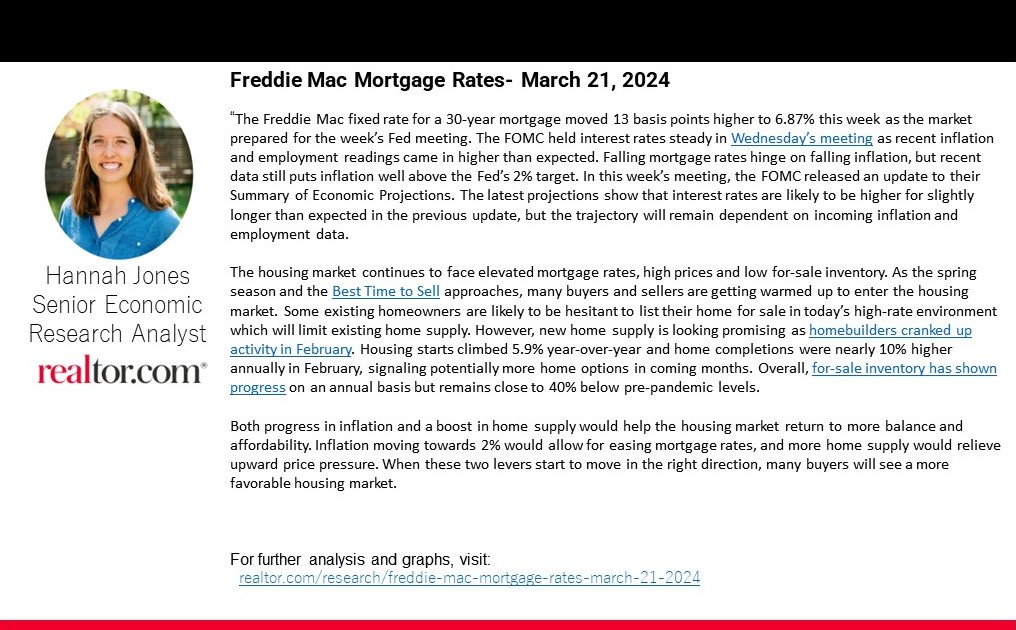
The 30yr fixed mortgage rate bumped slightly higher, up 3 bps to 6.82% according to Freddie Mac data, but was still within its recent range. Investors have braced for more inflation, pushing 10yr yields up past 4.35% which could mean further increases, depending on upcoming data.

The 30yr fixed mortgage rate bumped slightly higher, up 3 bps to 6.82% according to @FreddieMac data, but was still within its recent range. Investors have braced for more inflation, pushing 10yr yields up past 4.35% which could mean further increases, depending on upcoming data.
account_circle
Realtor.com Economics(@RDC_Economics) 's Twitter Profile Photo

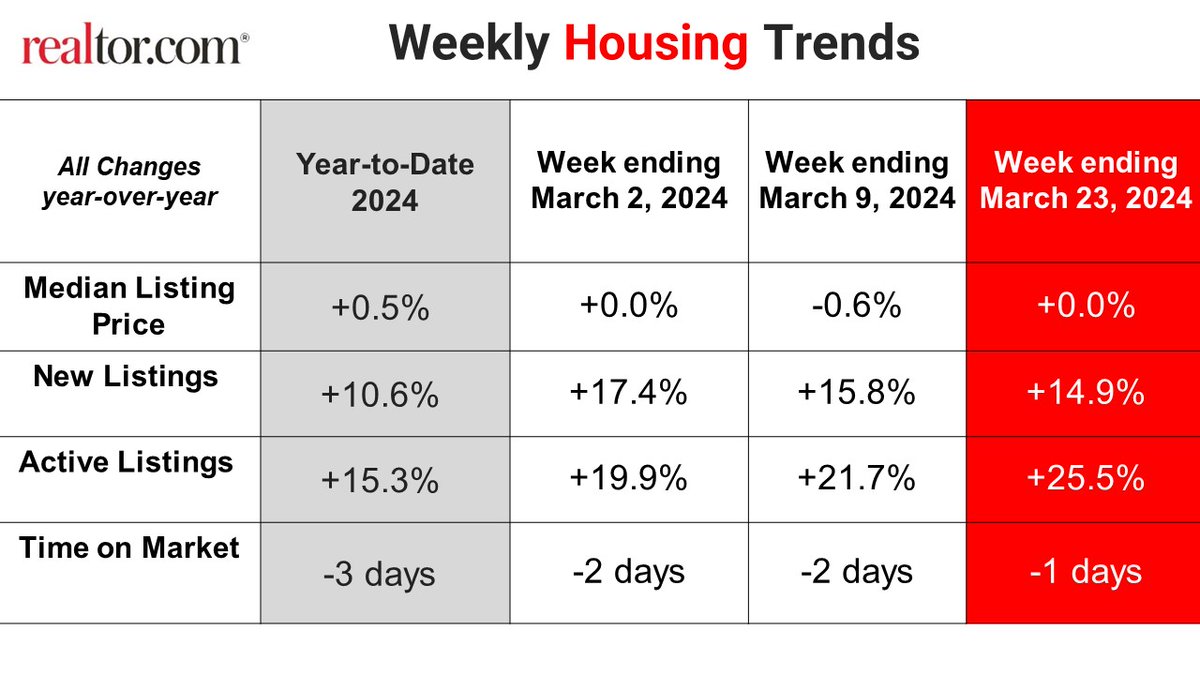
As the number of fresh listings continues to grow, homebuyers this spring have a wider array of options compared to this time last year. Additionally, the increased listings might put some downward pressure on prices, offering relief to homebuyers. realtor.com/research/weekl…

As the number of fresh listings continues to grow, homebuyers this spring have a wider array of options compared to this time last year. Additionally, the increased listings might put some downward pressure on prices, offering relief to homebuyers. realtor.com/research/weekl…
account_circle
Realtor.com Economics(@RDC_Economics) 's Twitter Profile Photo

Homes spent one day less on the market compared to this time last year. For 25 weeks in a row, the typical home spent less time on the market than the same week one year prior, the smallest gap since November 2023. realtor.com/research/weekl…

Homes spent one day less on the market compared to this time last year. For 25 weeks in a row, the typical home spent less time on the market than the same week one year prior, the smallest gap since November 2023. realtor.com/research/weekl…
account_circle
Realtor.com Economics(@RDC_Economics) 's Twitter Profile Photo

Active inventory increased, with for-sale homes 25.5% above year ago levels. For an 20th straight week, active listings registered above prior year level, which means that today’s home shoppers are able to consider more options for existing homes for sale. realtor.com/research/weekl…

Active inventory increased, with for-sale homes 25.5% above year ago levels. For an 20th straight week, active listings registered above prior year level, which means that today’s home shoppers are able to consider more options for existing homes for sale. realtor.com/research/weekl…
account_circle
Realtor.com Economics(@RDC_Economics) 's Twitter Profile Photo

New listings–a measure of sellers putting homes up for sale–were up this week, by 14.9% from one year ago.
For the 22nd consecutive week, newly listed homes have surpassed levels from a year ago. realtor.com/research/weekl…

New listings–a measure of sellers putting homes up for sale–were up this week, by 14.9% from one year ago. For the 22nd consecutive week, newly listed homes have surpassed levels from a year ago. realtor.com/research/weekl…
account_circle
Realtor.com Economics(@RDC_Economics) 's Twitter Profile Photo

In February 2024, the cost of buying a starter home in the top 50 metros was $1,027 (60.1%) higher than renting one. realtor.com/research/febru…

account_circle
Realtor.com Economics(@RDC_Economics) 's Twitter Profile Photo

This past week, the median price for homes listed on the market remained flat compared to the same period last year. realtor.com/research/weekl…

This past week, the median price for homes listed on the market remained flat compared to the same period last year. realtor.com/research/weekl…
account_circle
Realtor.com Economics(@RDC_Economics) 's Twitter Profile Photo

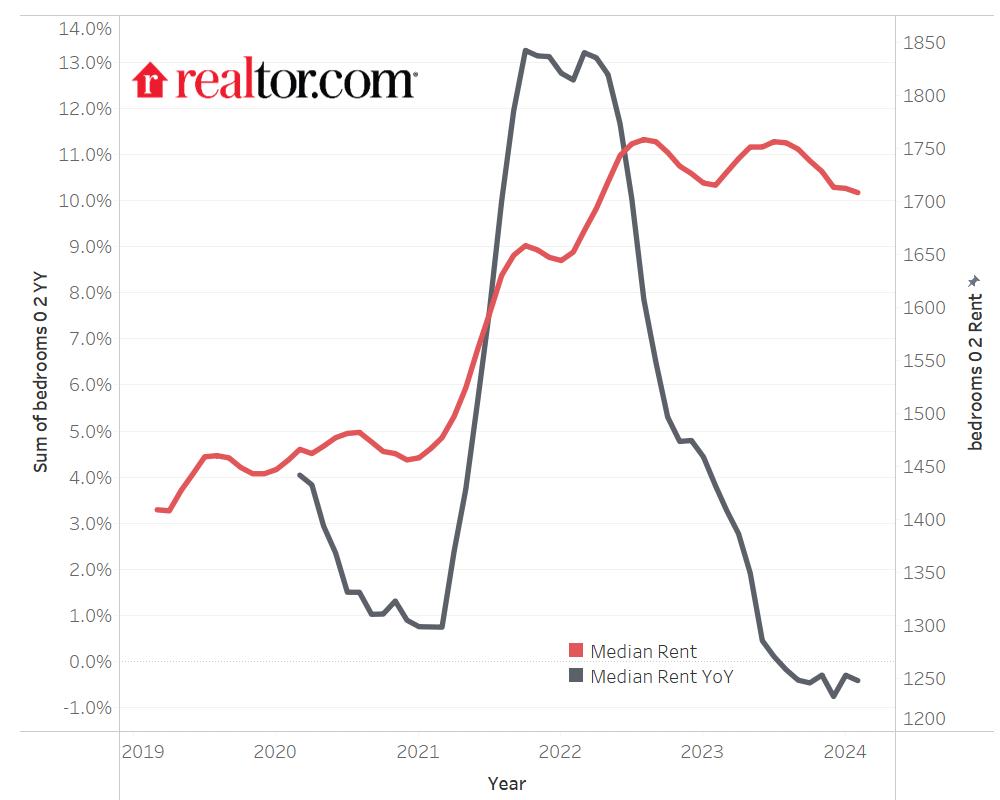
Despite the seven months of decline, the U.S. median rent in February was just $50 (-2.8%) less than the peak seen in August 2022. Notably, it was still $252 (17.3%) higher than the same time in 2020 (before the COVID-19 pandemic). realtor.com/research/febru…

Despite the seven months of decline, the U.S. median rent in February was just $50 (-2.8%) less than the peak seen in August 2022. Notably, it was still $252 (17.3%) higher than the same time in 2020 (before the COVID-19 pandemic). realtor.com/research/febru…
account_circle
Realtor.com Economics(@RDC_Economics) 's Twitter Profile Photo

Time on the market decreased compared to last year in 37 of the 50 largest metro areas this February. Time on the market decreased the most in Las Vegas (-25 days), Raleigh (-22 days), and St. Louis and Phoenix (-16 days each) realtor.com/research/febru…

account_circle
Realtor.com Economics(@RDC_Economics) 's Twitter Profile Photo

In February, 44 metros saw new listings increase YY. The metros that saw the largest growth in newly listed homes included Seattle (+41.7%), Minneapolis (+37.4%), and Tampa (+25.3%) realtor.com/research/febru…

account_circle
Realtor.com Economics(@RDC_Economics) 's Twitter Profile Photo

Among the 50 largest metro areas, only three metros saw higher levels of inventory in February compared to typical 2017 to 2019 levels. The top three were in the South: San Antonio (+27.6%), Austin (+10.8%), and Dallas (+2.2%). realtor.com/research/febru…

account_circle
Realtor.com Economics(@RDC_Economics) 's Twitter Profile Photo

No change to the Fed Funds rate today. The Fed's outlook remains pretty sanguine, with moderate improvements in both unemployment and GDP growth relative to Dec projections. The Fed still anticipates 3 25bps rate cuts in 2024. More here: realtor.com/research/feder…

No change to the Fed Funds rate today. The Fed's outlook remains pretty sanguine, with moderate improvements in both unemployment and GDP growth relative to Dec projections. The Fed still anticipates 3 25bps rate cuts in 2024. More here: realtor.com/research/feder…
account_circle
Realtor.com Economics(@RDC_Economics) 's Twitter Profile Photo

In February, the metros that saw the most inventory growth included Orlando (+38.5%), Miami (37.4%), and Tampa (36.3%). Despite higher inventory growth compared to last year, most metros still had a lower inventory when compared to pre-pandemic years. realtor.com/research/febru…

account_circle
Realtor.com Economics(@RDC_Economics) 's Twitter Profile Photo

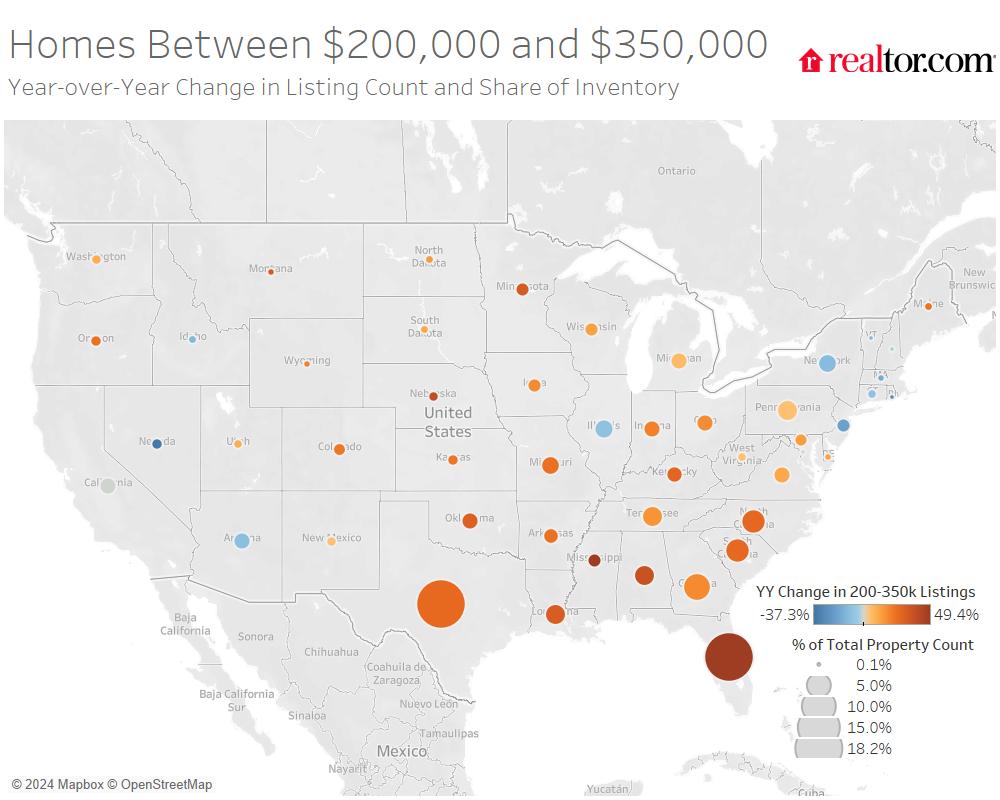
the South as a whole has been largely driving the increase in availability of homes priced between $200,000 and $350,000, a price category that saw the most year-over-year growth nationally realtor.com/research/febru…

the South as a whole has been largely driving the increase in availability of homes priced between $200,000 and $350,000, a price category that saw the most year-over-year growth nationally realtor.com/research/febru…
account_circle
Realtor.com Economics(@RDC_Economics) 's Twitter Profile Photo

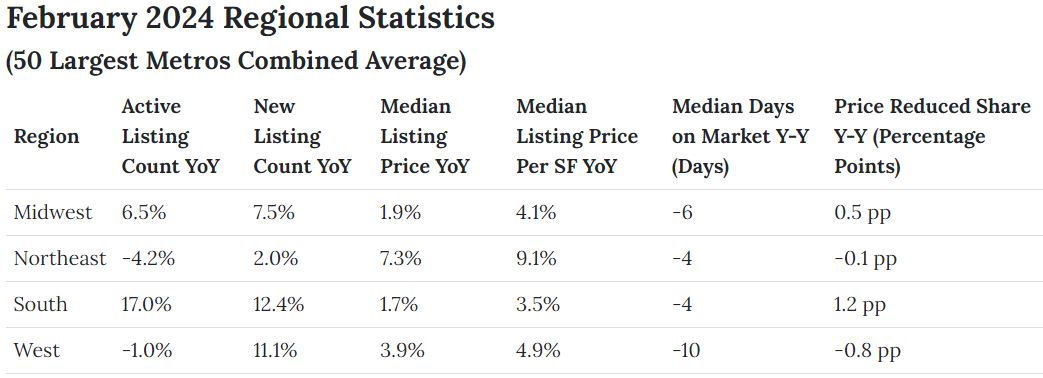
The rise in active listings in Feb was primarily driven by Southern metros, which saw active home listings grow by 17.0% YY. MW metros also saw active inventory grow YY by 6.5% on avg realtor.com/research/febru…

The rise in active listings in Feb was primarily driven by Southern metros, which saw active home listings grow by 17.0% YY. MW metros also saw active inventory grow YY by 6.5% on avg realtor.com/research/febru…
account_circle