R CODER | Jose Carlos Soage 📊
@rcoderweb
Learn R! #rstats
IN: linkedin.com/in/jose-carlos…
También en español 😉
🔗 r-charts.com
🔗 python-charts.com
🔗 r-packages.io
ID: 1303059616679579657
https://r-coder.com/ 07-09-2020 19:58:30
577 Tweet
10,10K Followers
52 Following


I've been trying out different ways of creating dumbbell charts with {ggplot2}. For this one I used a 'wide' summary table for the source data (which feels more intuitive to me). The method owes a lot to this tutorial from R CODER | Jose Carlos Soage 📊: r-charts.com/distribution/d… #rstats #ggplot2


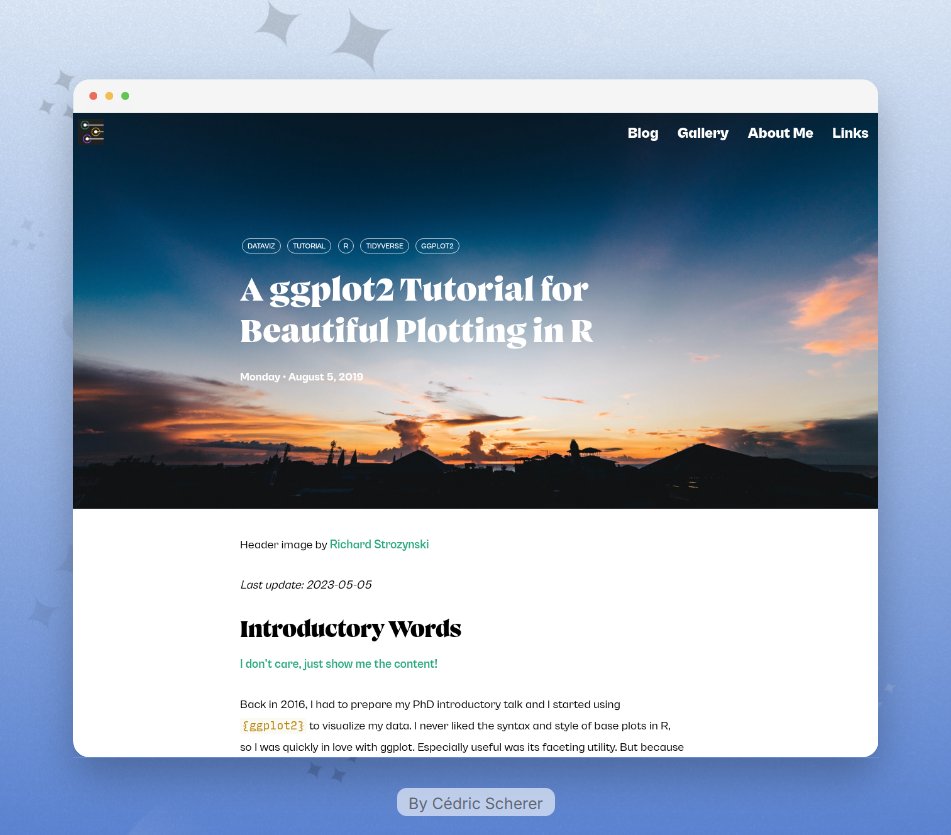
🚀 This #ggplot2 tutorial by Cédric Scherer never gets old! 📊 One of the best resources to master beautiful plotting in R 🔗 cedricscherer.netlify.app/2019/08/05/a-g…


👋 If you enjoy the R content I share here, you might also like what I post on my (new) personal account: data science, AI, and entrepreneurship Follow me at 👉 [José Carlos Soage ] Or on LinkedIn (in Spanish) 👉 linkedin.com/in/jose-carlos… #rstats #datascience
![R CODER | Jose Carlos Soage 📊 (@rcoderweb) on Twitter photo 👋 If you enjoy the R content I share here, you might also like what I post on my (new) personal account: data science, AI, and entrepreneurship
Follow me at 👉 [<a href="/josecarlossoage/">José Carlos Soage</a> ]
Or on LinkedIn (in Spanish) 👉 linkedin.com/in/jose-carlos…
#rstats #datascience 👋 If you enjoy the R content I share here, you might also like what I post on my (new) personal account: data science, AI, and entrepreneurship
Follow me at 👉 [<a href="/josecarlossoage/">José Carlos Soage</a> ]
Or on LinkedIn (in Spanish) 👉 linkedin.com/in/jose-carlos…
#rstats #datascience](https://pbs.twimg.com/media/GqQIvmuWUAAyoui.jpg)


![R CODER | Jose Carlos Soage 📊 (@rcoderweb) on Twitter photo [FREE BOOK]
Statistical Inference via Data Science: A ModernDive into R and the Tidyverse
Written by Chester Ismay and Albert Y. Kim
🔗 moderndive.com [FREE BOOK]
Statistical Inference via Data Science: A ModernDive into R and the Tidyverse
Written by Chester Ismay and Albert Y. Kim
🔗 moderndive.com](https://pbs.twimg.com/media/Gkp7NgmWcAAeCsJ.jpg)
![R CODER | Jose Carlos Soage 📊 (@rcoderweb) on Twitter photo [FREE ONLINE BOOK] 📗
R Markdown: The Definitive Guide
Learn how to create dynamic reports, presentations, and interactive documents with R Markdown!
🔗 bookdown.org/yihui/rmarkdow…
#rstats #DataScience [FREE ONLINE BOOK] 📗
R Markdown: The Definitive Guide
Learn how to create dynamic reports, presentations, and interactive documents with R Markdown!
🔗 bookdown.org/yihui/rmarkdow…
#rstats #DataScience](https://pbs.twimg.com/media/GmPAZPXXcAAD6hf.jpg)
![R CODER | Jose Carlos Soage 📊 (@rcoderweb) on Twitter photo [FREE R BOOK]
🚀 "Tidy Modeling with R" by Max Kuhn & Julia Silge is a must-read! 📘 Learn how to streamline your ML workflow using the tidymodels framework
🔗 tmwr.org
#RStats #MachineLearning [FREE R BOOK]
🚀 "Tidy Modeling with R" by Max Kuhn & Julia Silge is a must-read! 📘 Learn how to streamline your ML workflow using the tidymodels framework
🔗 tmwr.org
#RStats #MachineLearning](https://pbs.twimg.com/media/GmZoggta8AU0VfJ.jpg)


