Polar Portal (@polarportal) 's Twitter Profile
Polar Portal

@polarportal

Danish Arctic research institutions present updated knowledge on the condition of two major components of the Arctic: The Greenland Ice Sheet and the sea ice

ID: 1399429982

linkhttp://polarportal.org calendar_today03-05-2013 10:39:42

3,3K Tweet

6,6K Followers

617 Following

Polar Portal (@polarportal) 's Twitter Profile Photo

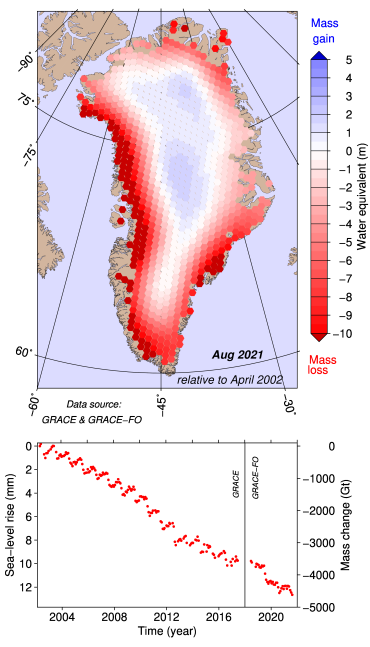
GRACE data updated to August 2021, see polarportal.dk/en/greenland/m…. Since measurements began in April 2002, the Greenland Ice Sheet has lost about 4700 gigatons (=4700 km³, enough to cover the entire U.S. by half a meter of water). This melt has contributed 1.2 cm to sea level rise.

GRACE data updated to August 2021, see polarportal.dk/en/greenland/m…. Since measurements began in April 2002, the Greenland Ice Sheet has lost about 4700 gigatons (=4700 km³, enough to cover the entire U.S. by half a meter of water). This melt has contributed 1.2 cm to sea level rise.
Polar Portal (@polarportal) 's Twitter Profile Photo

Today 20 years ago, the joint NASA and DLR_de #GRACE satellites "Tom and Jerry" were launched. They measure the mass loss of the Greenland Ice Sheet. From April 2002 to August 2021, Greenland has lost almost 4700 gigatons, enough to cover the entire U.S. with 48 cm of water.

Today 20 years ago, the joint <a href="/NASA/">NASA</a> and <a href="/DLR_de/">DLR_de</a> #GRACE satellites "Tom and Jerry" were launched. They measure the mass loss of the Greenland Ice Sheet. From April 2002 to August 2021, Greenland has lost almost 4700 gigatons, enough to cover the entire U.S. with 48 cm of water.
Polar Portal (@polarportal) 's Twitter Profile Photo

May 28 was the first of three days in a row with melting over at least 5% of the area of Greenland. This is two days later than the average 1981-2021.

May 28 was the first of three days in a row with melting over at least 5% of the area of Greenland. This is two days later than the average 1981-2021.
Polar Portal (@polarportal) 's Twitter Profile Photo

After a comparably cool summer, #Greenland is now experiencing a record warm September. Figure shows percentage of area with melting. Grey line and area: 30 year average 1981-2010 and lowest and highest percentages for each calendar day, blue line: September 2022.

After a comparably cool summer, #Greenland is now experiencing a record warm September. Figure shows percentage of area with melting. Grey line and area: 30 year average 1981-2010 and lowest and highest percentages for each calendar day, blue line: September 2022.
Aman Chokshi (@aman_chokshi) 's Twitter Profile Photo

The South Pole officially recorded sunrise at 12:47pm NZDT yesterday! The inversion was crazy with constant mirages along the horizon, which resulted in this green flash! Everyone had so much energy at the U.S. National Science Foundation Amundsen-Scott Station yesterday ☀️

The South Pole officially recorded sunrise at 12:47pm NZDT yesterday! The inversion was crazy with constant mirages along the horizon, which resulted in this green flash! Everyone had so much energy at the <a href="/NSF/">U.S. National Science Foundation</a> Amundsen-Scott Station yesterday ☀️
Polar Portal (@polarportal) 's Twitter Profile Photo

Daily surface mass balance product is available again. Thanks for your patience! Den daglige overflademassebalance er til rådighed igen. Tak for tålmodigheden!

Polar Portal (@polarportal) 's Twitter Profile Photo

On 2 June, melting occurred over 13% of the surface area of the Greenland Ice Sheet - that was the third day in a row exceeding 5%. Thus, the onset of the melting season 2023 was on 31 May, five days later than the median over 1981-2022. See our Mastodon accounts for details.

On 2 June, melting occurred over 13% of the surface area of the Greenland Ice Sheet - that was the third day in a row exceeding 5%. Thus, the onset of the melting season 2023 was on 31 May, five days later than the median over 1981-2022. See our Mastodon accounts for details.
Polar Portal (@polarportal) 's Twitter Profile Photo

Extreme melting event over Greenland - very unusual so early in the season. However, the surface mass balance is still positive. Is this a contradiction? Not really - over the last few days, lots of wet snow have been dumped on eastern Greenland (magenta: snow; green: rain).

Extreme melting event over Greenland - very unusual so early in the season. However, the surface mass balance is still positive. Is this a contradiction? Not really - over the last few days, lots of wet snow have been dumped on eastern Greenland (magenta: snow; green: rain).
Polar Portal (@polarportal) 's Twitter Profile Photo

Yesterday was the 3rd day in a row with a SMB less that -1 Gt. Thus, the onset of the ablation season was on 29 June, the 5th latest of the 42 years with data. Does that mean there is no global warming? Unfortunately not: warm in north-central Europe often means cool in Greenland

Yesterday was the 3rd day in a row with a SMB less that -1 Gt. Thus, the onset of the ablation season was on 29 June, the 5th latest of the 42 years with data.
Does that mean there is no global warming? Unfortunately not: warm in north-central Europe often means cool in Greenland
Polar Portal (@polarportal) 's Twitter Profile Photo

The "surface mass balance year" 1 Sep 2022 to 31 Aug 2023 ended with an accumulated SMB of 397.8 Gt, about 50 Gt more than the median 1980-2023, i.e. rank 29 of 43 years with data. Note: this is NOT the TOTAL mass balance, which also takes into account calving of icebergs.

The "surface mass balance year" 1 Sep 2022 to 31 Aug 2023 ended with an accumulated SMB of 397.8 Gt, about 50 Gt more than the median 1980-2023, i.e. rank 29 of 43 years with data. Note: this is NOT the TOTAL mass balance, which also takes into account calving of icebergs.
Polar Portal (@polarportal) 's Twitter Profile Photo

The accumulated surface mass balance (SMB) for the "SMB year" 1 September 2023 to 31 August 2024 ended at 367.3 Gt (=km³), close to the average 1980-2024. This is SMB only, not total mass balance, which includes iceberg calving and melting of glaciers in contact with sea water!

The accumulated surface mass balance (SMB) for the "SMB year" 1 September 2023 to 31 August 2024 ended at 367.3 Gt (=km³), close to the average 1980-2024.
This is SMB only, not total mass balance, which includes iceberg calving and melting of glaciers in contact with sea water!