Ole S Hansen(@Ole_S_Hansen) 's Twitter Profileg
Ole S Hansen

@Ole_S_Hansen

Head of Commodity Strategy @SaxoBank and a regular contributor to both broadcast and print media. Broad focus, but mostly #gold #silver #copper #oil & #grains

ID:334571039

linkhttps://www.home.saxo/insights#analysis calendar_today13-07-2011 09:34:14

25,1K Tweets

62,1K Followers

611 Following

Ole S Hansen(@Ole_S_Hansen) 's Twitter Profile Photo

trades up 20.5% YTD with EURUSD being challenged by the prospect for a June ECB rate cut. meanwhile trades up 25% as the BOJ stand accused of hiking to slowly

#XAUEUR trades up 20.5% YTD with EURUSD being challenged by the prospect for a June ECB rate cut. #XAUJPY meanwhile trades up 25% as the BOJ stand accused of hiking to slowly
account_circle
Ole S Hansen(@Ole_S_Hansen) 's Twitter Profile Photo

Commodity weekly: Gold and silver surge at odds with other market developments, amplifying signal value social.saxo/i35hwdi?uuid=F…

account_circle
Ole S Hansen(@Ole_S_Hansen) 's Twitter Profile Photo

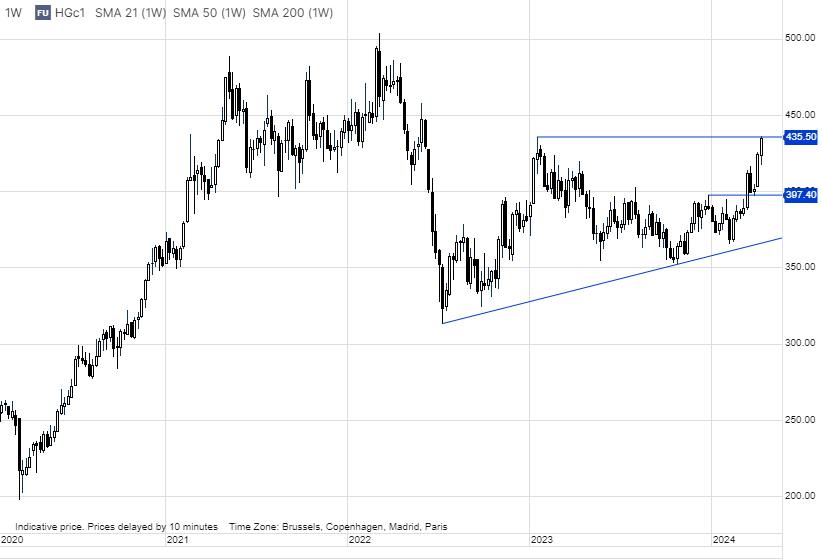
FOMO spreads to with now challenging the Jan 2023 high at $4.355. A rise in China exchange-monitored stocks to a four-year highlighting local traders concern about Yuan devaluation. Hence the hoarding of not only gold and silver, but now also copper.

FOMO spreads to #copper with #HG_f now challenging the Jan 2023 high at $4.355. A rise in China exchange-monitored stocks to a four-year highlighting local traders concern about Yuan devaluation. Hence the hoarding of not only gold and silver, but now also copper.
account_circle
Ole S Hansen(@Ole_S_Hansen) 's Twitter Profile Photo

China March import of key :
Crude oil: 11.58m b/d, -6.2% YoY (+4% MoM)
Natural gas: 10.8m tons, +21.3% YoY
Coal: 41.4m tons, +22.6% YoY
Copper: 2.33m tons, +15.4% YoY
Iron Ore: 100,7m tons, flat YoY
Soybeans: 5.54m tons, -19.1% YoY
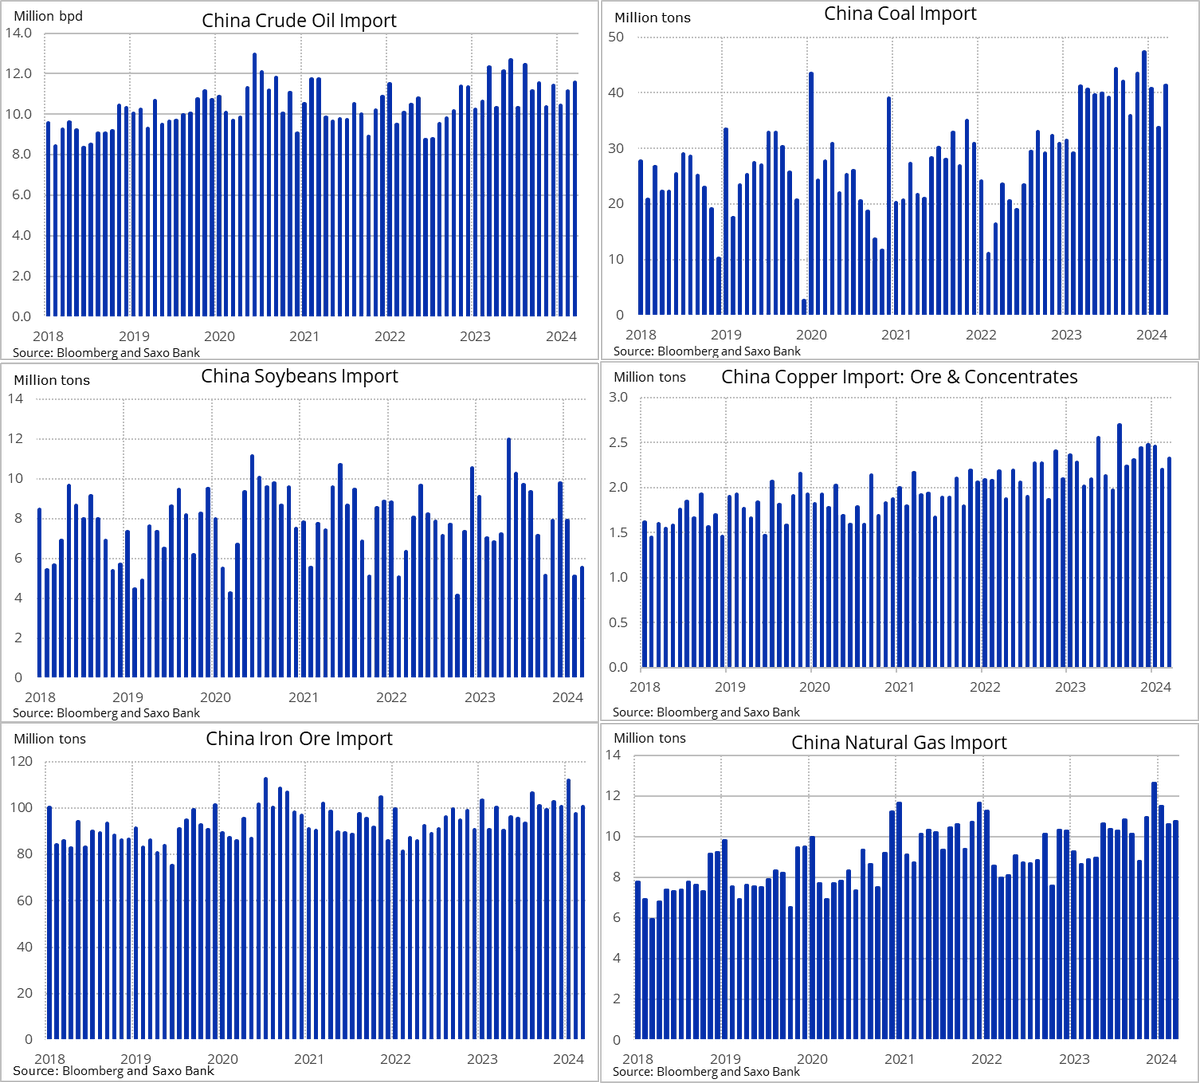
China March import of key #commodities: Crude oil: 11.58m b/d, -6.2% YoY (+4% MoM) Natural gas: 10.8m tons, +21.3% YoY Coal: 41.4m tons, +22.6% YoY Copper: 2.33m tons, +15.4% YoY Iron Ore: 100,7m tons, flat YoY Soybeans: 5.54m tons, -19.1% YoY
account_circle
Ole S Hansen(@Ole_S_Hansen) 's Twitter Profile Photo

Watch as 's three-year uptrend is close to being challenged with the (Gold-silver ratio) trading near 82.50. During the past month, gold trades up 10% while silver has added around 20%.

Watch #silver as #gold's three-year uptrend is close to being challenged with the #XAUXAG (Gold-silver ratio) trading near 82.50. During the past month, gold trades up 10% while silver has added around 20%.
account_circle
Ole S Hansen(@Ole_S_Hansen) 's Twitter Profile Photo

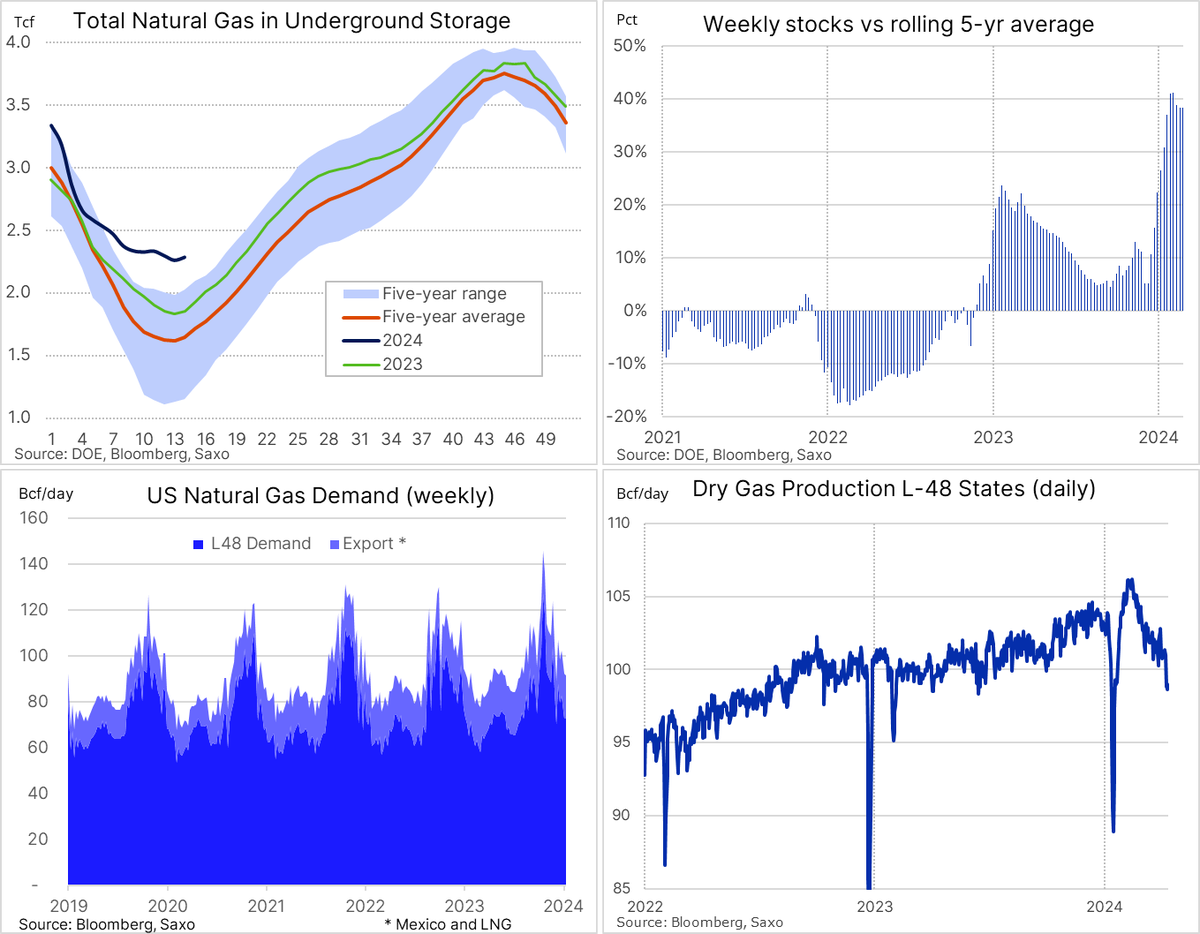
US fell the most since Feb on Thursday after the EIA reported a 24 bcf stock build vs 13 bcf expected. Stocks totaled 2,283 bcf, some 38% above the 5-yr avg. At $1.75 the contract trades on the 21-DMA line with a break potentially signaling further loss of momentum

US #natgas fell the most since Feb on Thursday after the EIA reported a 24 bcf stock build vs 13 bcf expected. Stocks totaled 2,283 bcf, some 38% above the 5-yr avg. At $1.75 the #NG_f contract trades on the 21-DMA line with a break potentially signaling further loss of momentum
account_circle
Karen Braun(@kannbwx) 's Twitter Profile Photo

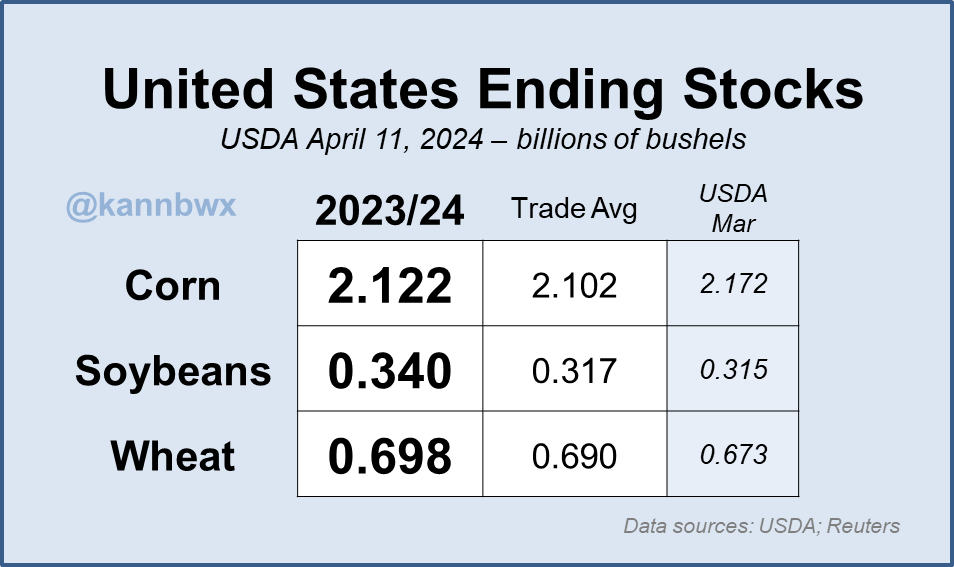
U.S. ending stock estimates for , and all come in higher than the trade guess. Corn & wheat exports were unch from March but soybean exports were cut 20 mbu to 1.7 bbu.

U.S. ending stock estimates for #corn, #soybeans and #wheat all come in higher than the trade guess. Corn & wheat exports were unch from March but soybean exports were cut 20 mbu to 1.7 bbu.
account_circle
Karen Braun(@kannbwx) 's Twitter Profile Photo

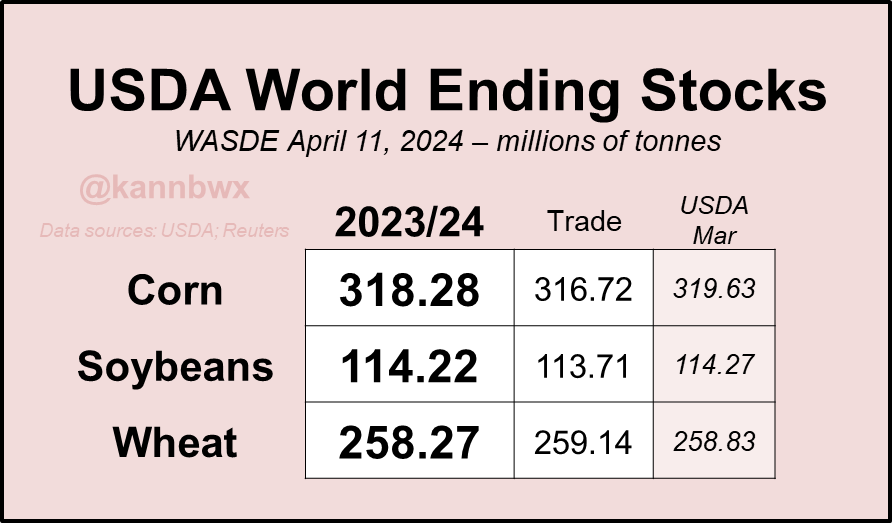
World ending stocks for , & all come in lower than last month, but corn & soy landed above the trade guess. Ukraine wheat exports were +1.5 mmt to 17.5 mmt, Russia exports +1 mmt to 52 mmt. EU wheat exports -2 mmt to 34.5 mmt. No big changes otherwise.

World ending stocks for #corn, #soybeans & #wheat all come in lower than last month, but corn & soy landed above the trade guess. Ukraine wheat exports were +1.5 mmt to 17.5 mmt, Russia exports +1 mmt to 52 mmt. EU wheat exports -2 mmt to 34.5 mmt. No big changes otherwise.
account_circle