MannyKaye(@MannyKayeXBT) 's Twitter Profileg
MannyKaye

@MannyKayeXBT

Head of Asia OTC Trading @krakenfx πŸ“ˆ & Cricket Aficionado 🏏 | Navigating financial markets and cricket pitches with equal passion

ID:1724767527891595264

calendar_today15-11-2023 12:33:28

38 Tweets

174 Followers

99 Following

MannyKaye(@MannyKayeXBT) 's Twitter Profile Photo

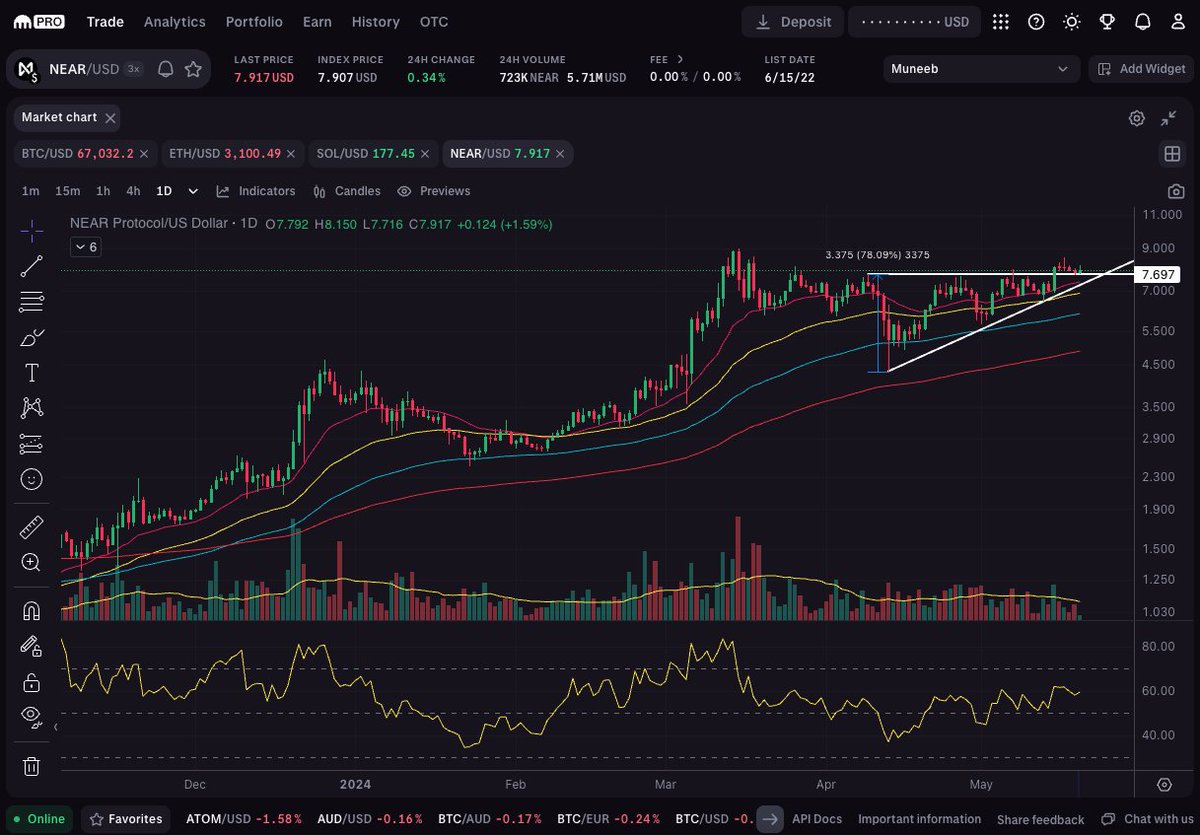
Great $BTCUSD analysis! Listen and watch closely when Aksel Kibar, CMT speaks. A new all-time high could be on the horizon, also keep an eye out on volume.

account_circle
MannyKaye(@MannyKayeXBT) 's Twitter Profile Photo

Happy Monday From Kraken OTC! Before we glance through some key charts explore our OTC portal for deeper insights ➑️ pro.kraken.com/app/otc/

On May 1st, $BTC briefly traded below support at $60,778 and closed beneath the 100-day EMA. The next day formed an inside bar. Despite

Happy Monday From Kraken OTC! Before we glance through some key charts explore our OTC portal for deeper insights ➑️ pro.kraken.com/app/otc/ On May 1st, $BTC briefly traded below support at $60,778 and closed beneath the 100-day EMA. The next day formed an inside bar. Despite
account_circle
MannyKaye(@MannyKayeXBT) 's Twitter Profile Photo

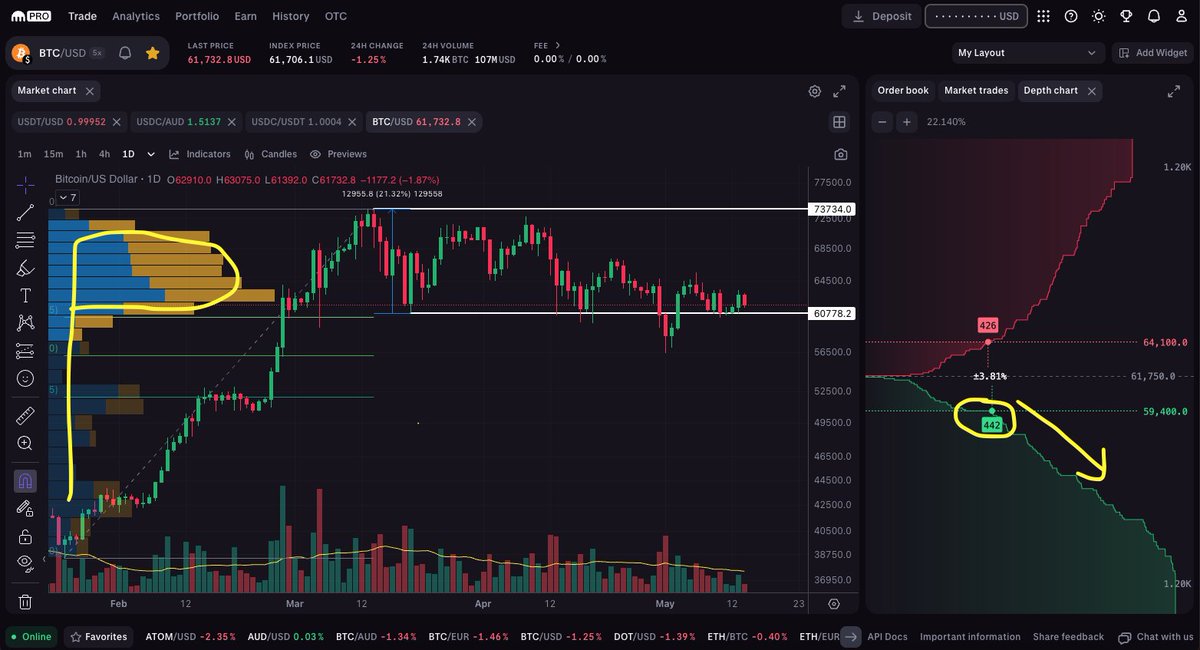
Spotting a clear 'P' shape in $BTC's volume profile, signalling an upward imbalance. Notably, order book liquidity is thinning below $59,400. A break below this level might trigger a quick descent to the swing low at $56,380.

For deeper insights, explore Kraken OTC ➑️

Spotting a clear 'P' shape in $BTC's volume profile, signalling an upward imbalance. Notably, order book liquidity is thinning below $59,400. A break below this level might trigger a quick descent to the swing low at $56,380. For deeper insights, explore Kraken OTC ➑️
account_circle
MannyKaye(@MannyKayeXBT) 's Twitter Profile Photo

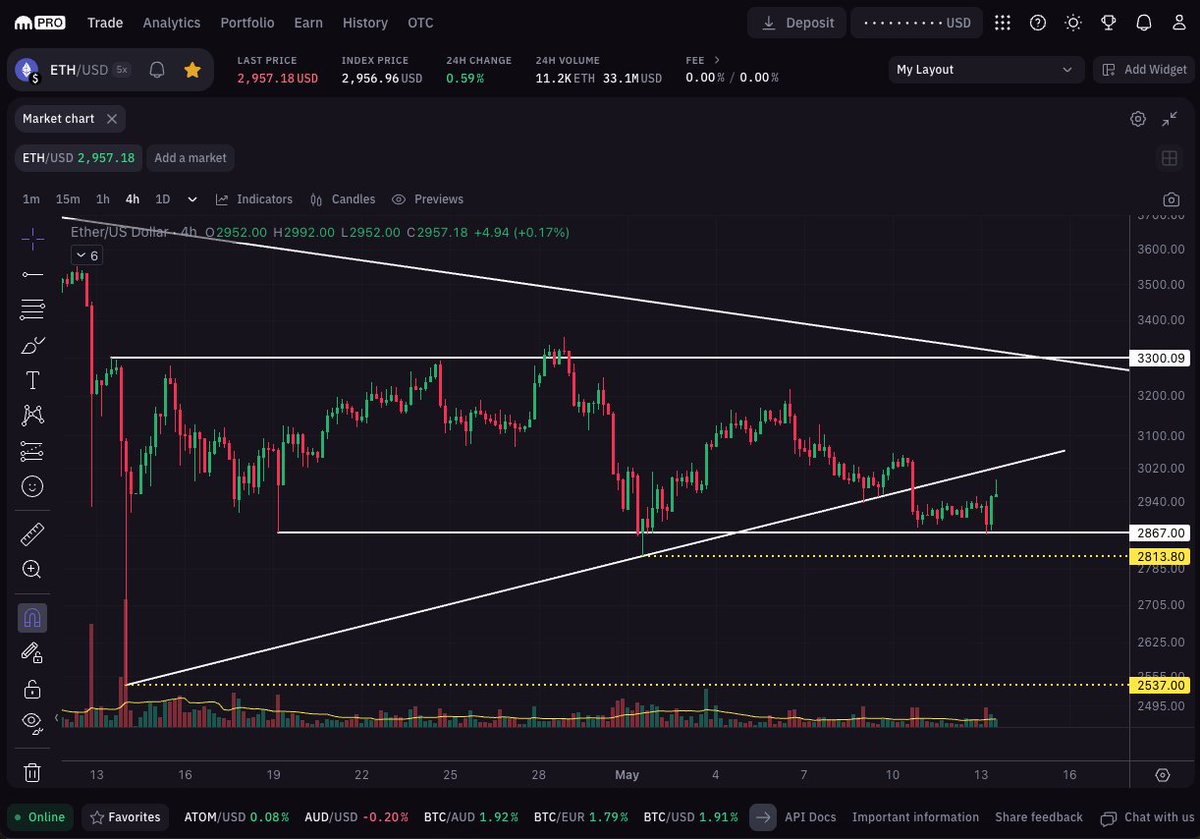
$ETH is hanging on by a thread. If we see a 4-hour candle close below $2,813, then a flush to the Apr 14th swing low of $2,537 is on the cards. How are you planning to navigate this potential dip? Share your moves!

For more insights visit Kraken OTC at pro.kraken.com/app/otc/quote

$ETH is hanging on by a thread. If we see a 4-hour candle close below $2,813, then a flush to the Apr 14th swing low of $2,537 is on the cards. How are you planning to navigate this potential dip? Share your moves! For more insights visit Kraken OTC at pro.kraken.com/app/otc/quote
account_circle
MannyKaye(@MannyKayeXBT) 's Twitter Profile Photo

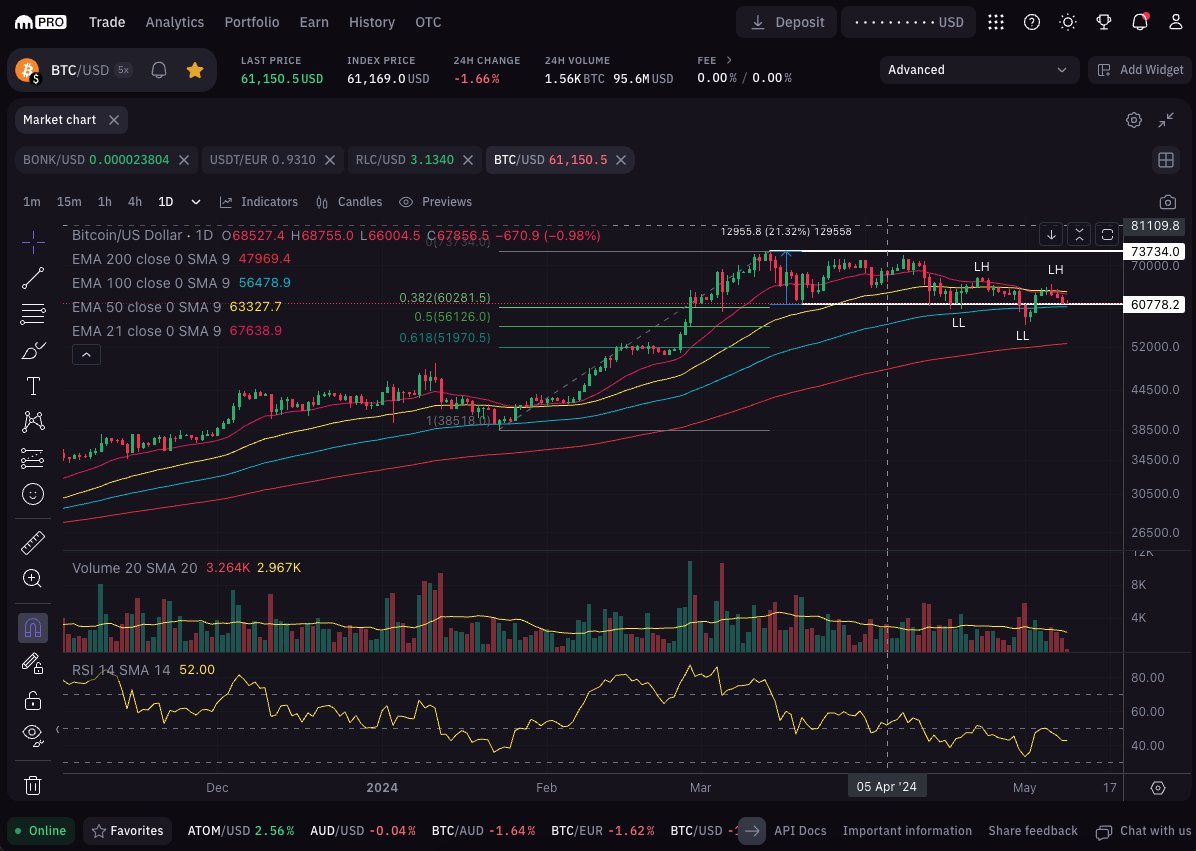
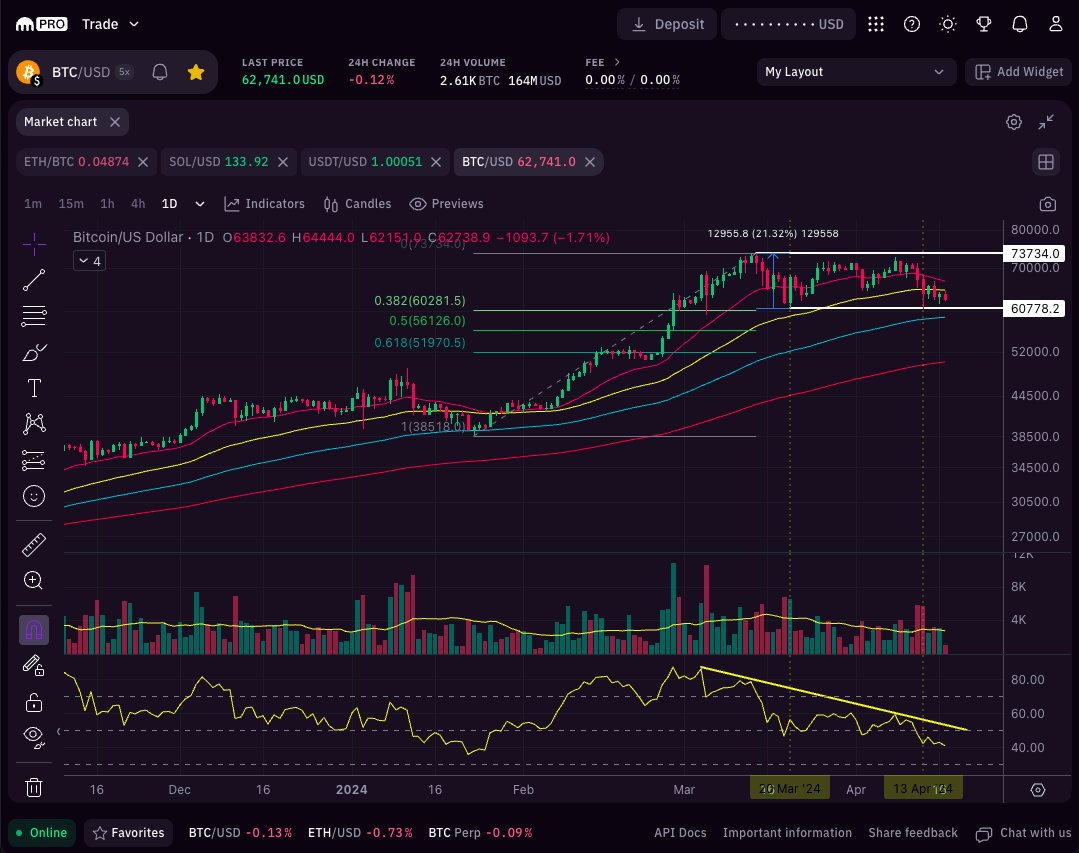
$BTC market structure is confirming lower lows followed by lower highs. The RSI is capped at 50 and the 21 & 50 day EMAs have served as resistance for the last 2 throwbacks. A decisive close here below the 100 day EMA likely leads to a new swing low below $56k and a test of the

$BTC market structure is confirming lower lows followed by lower highs. The RSI is capped at 50 and the 21 & 50 day EMAs have served as resistance for the last 2 throwbacks. A decisive close here below the 100 day EMA likely leads to a new swing low below $56k and a test of the
account_circle
MannyKaye(@MannyKayeXBT) 's Twitter Profile Photo

πŸ” BTC Update

After a hammer on the daily chart at $60,778, $BTC formed a tweezer top on the H1. It's been hovering around the 50-day EMA ($64,680), more broadly it remains range bound between $60,778 and $73,734. Despite the range, RSI shows lower highs suggesting a potential

πŸ” BTC Update After a hammer on the daily chart at $60,778, $BTC formed a tweezer top on the H1. It's been hovering around the 50-day EMA ($64,680), more broadly it remains range bound between $60,778 and $73,734. Despite the range, RSI shows lower highs suggesting a potential
account_circle