KAP. Design (@kapdesign) 's Twitter Profile
KAP. Design

@kapdesign

Creating visual content and design to communicate information about sustainability, climate change, research. Tweets by @JamieKapitain Instagram: bit.ly/2SgtIol

ID: 48434782

linkhttp://www.kapdesign.ca calendar_today18-06-2009 18:09:17

384 Tweet

305 Takipçi

210 Takip Edilen

KAP. Design (@kapdesign) 's Twitter Profile Photo

Millions of birds die annually from window collisions. Here's part of an infographic about a #birdproofing solution. See the entire infographic on the KAP website at kapdesign.ca/work/bird-safe… #LiveBirdFriendly #birdconservation #infographic

Millions of birds die annually from window collisions. Here's part of an infographic about a #birdproofing solution. See the entire infographic on the KAP website at kapdesign.ca/work/bird-safe… #LiveBirdFriendly  #birdconservation #infographic
KAP. Design (@kapdesign) 's Twitter Profile Photo

Over the next week, we will be sharing some of the infographics we've designed for research into birds. This #infographic is about the influence of urbanization on migratory songbird abundance. #scicomm #visualabstract

Over the next week, we will be sharing some of the infographics we've designed for research into birds. This #infographic is about the influence of urbanization on migratory songbird abundance. #scicomm #visualabstract
KAP. Design (@kapdesign) 's Twitter Profile Photo

The second in our bird #research #infographic series, this visual asset highlights research on Common Nighthawk migratory connectivity and conservation. #scicomm #visualabstract

The second in our bird #research #infographic series, this visual asset highlights research on Common Nighthawk migratory connectivity and conservation. #scicomm #visualabstract
KAP. Design (@kapdesign) 's Twitter Profile Photo

This is the third bird research infographic in our series! We collaborated with @Nature_Is_Grand and Birds Canada to create this #infographic highlighting songbird migration research. #scicomm #visualabstract #Motus #ornithology
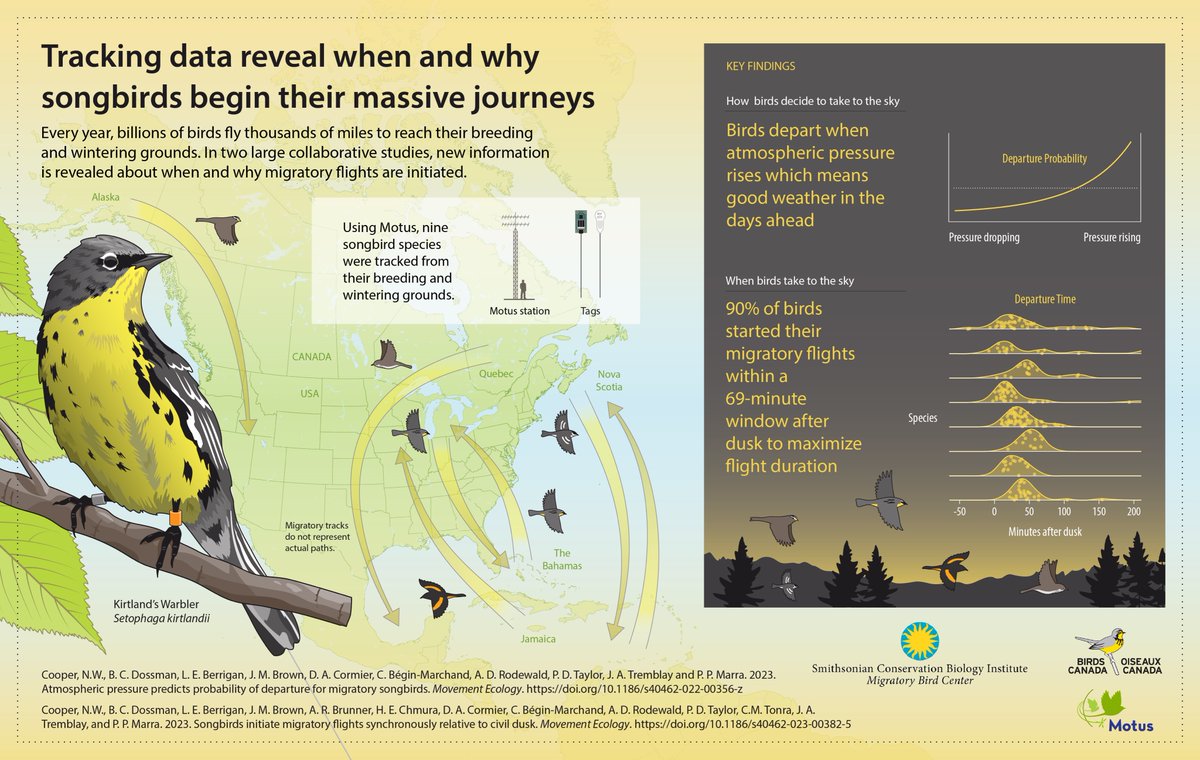
This is the third bird research infographic in our series! We collaborated with @Nature_Is_Grand and <a href="/BirdsCanada/">Birds Canada</a> to create this #infographic highlighting songbird migration research. #scicomm #visualabstract #Motus #ornithology
KAP. Design (@kapdesign) 's Twitter Profile Photo

Number four in our bird #research #infographic series, this visual asset explains research into Lesser Yellowlegs migration and harvest exposure. #scicomm #ornithology #visualabstract #migration

Number four in our bird #research #infographic series, this visual asset explains research into Lesser Yellowlegs migration and harvest exposure. #scicomm #ornithology #visualabstract #migration
KAP. Design (@kapdesign) 's Twitter Profile Photo

This is the fifth and final bird research #infographic in our series. Another collaboration with Dr. Ryan Norris, this infographic visualizes research into population growth of Canada Jays.#scicomm #visualabstract #ornithology

This is the fifth and final bird research #infographic in our series. Another collaboration with <a href="/RyanNorrisSci/">Dr. Ryan Norris</a>, this infographic visualizes research into population growth of Canada Jays.#scicomm #visualabstract #ornithology
KAP. Design (@kapdesign) 's Twitter Profile Photo

Visual Note 2. Urban trees can reduce temperatures in addition to many other benefits - clean the air, maintain biodiversity, control water. #infographic #heatwave #climatesolutions

Visual Note 2. Urban trees can reduce temperatures in addition to many other benefits - clean the air, maintain biodiversity, control water. #infographic #heatwave #climatesolutions
KAP. Design (@kapdesign) 's Twitter Profile Photo

KAP has collaborated again with Intact Centre | Centre Intact to create this #infographic asset about reducing climate risk at home using natural solutions. #climateadaptation #heatprotection #floodprotection #wildfireprotection
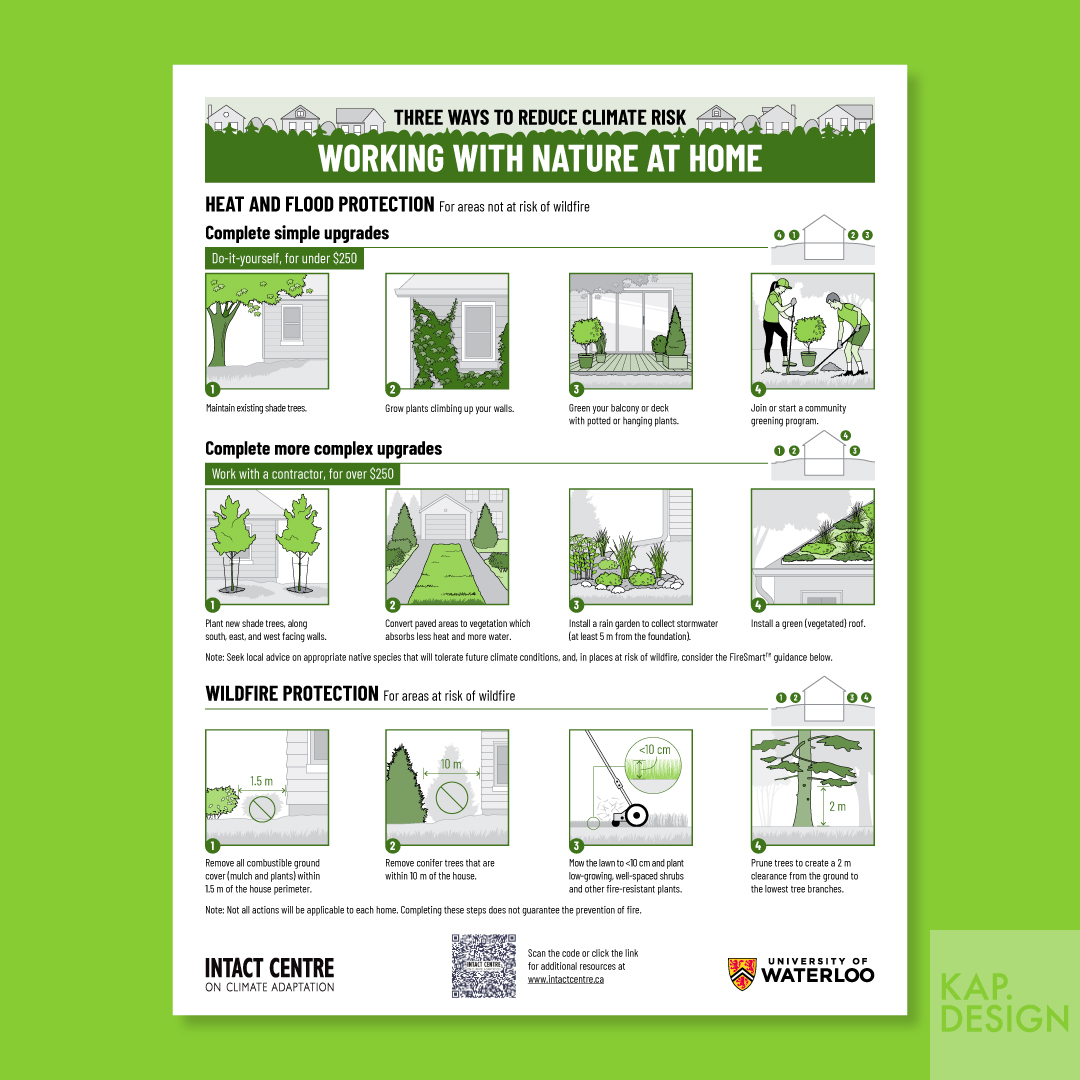
KAP has collaborated again with <a href="/ICCA_Canada/">Intact Centre | Centre Intact</a> to create this #infographic asset about reducing climate risk at home using natural solutions. #climateadaptation #heatprotection #floodprotection #wildfireprotection
KAP. Design (@kapdesign) 's Twitter Profile Photo

This Wildfire-Ready Community infographic is one of six in the 'Climate-Ready' infographic series KAP has created with the Intact Centre | Centre Intact. See all six at intactcentreclimateadaptation.ca/climate-ready-… #wildfireprotection #climateready #infographic
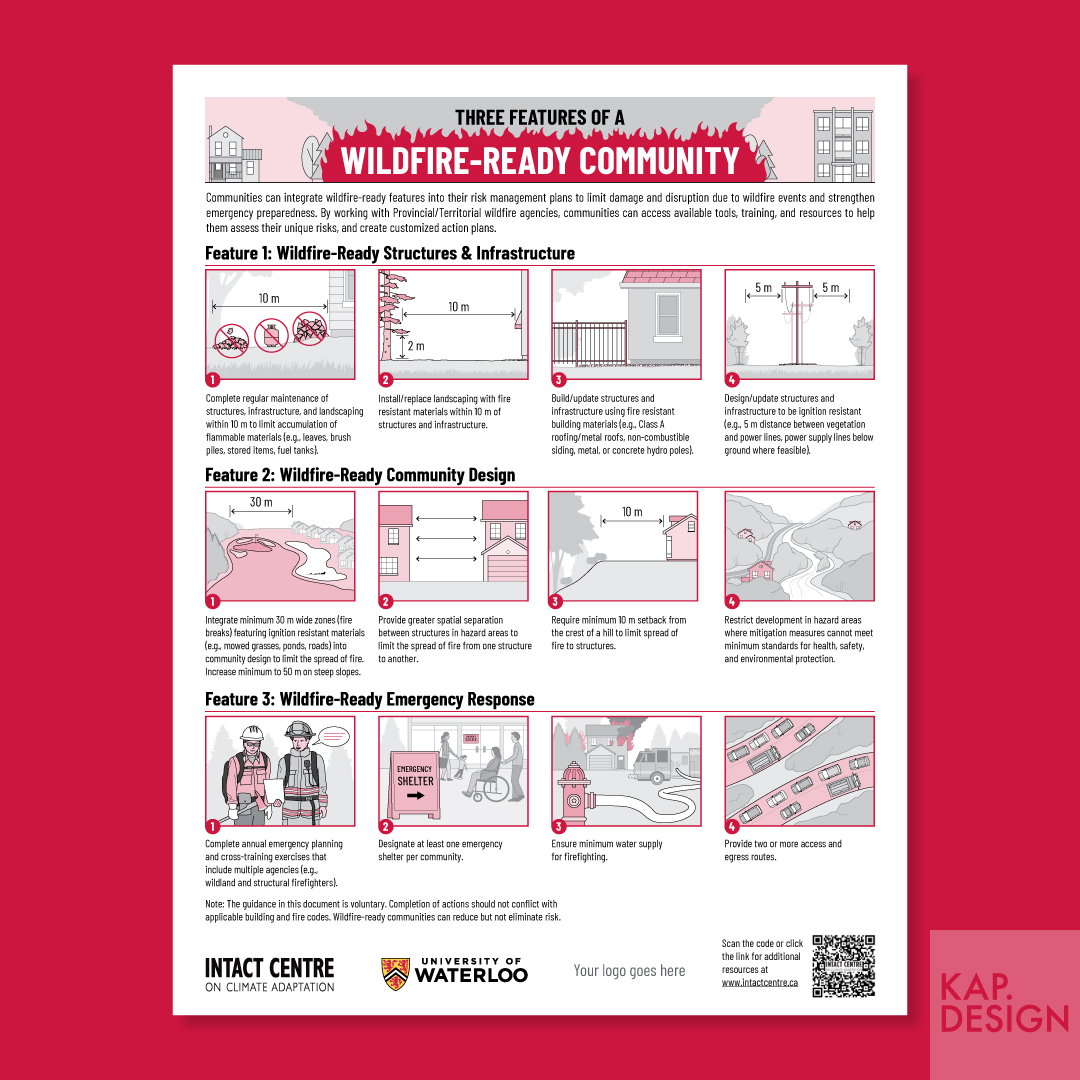
This Wildfire-Ready Community infographic is one of six in the 'Climate-Ready' infographic series KAP has created with the <a href="/ICCA_Canada/">Intact Centre | Centre Intact</a>. See all six at intactcentreclimateadaptation.ca/climate-ready-… #wildfireprotection #climateready #infographic
KAP. Design (@kapdesign) 's Twitter Profile Photo

KAP has collaborated with many researchers and organizations to create visual abstracts and infographics that increase engagement. #infographics #visualabstracts #scicomm

KAP has collaborated with many researchers and organizations to create visual abstracts and infographics that increase engagement. #infographics #visualabstracts #scicomm
Eric M. Wood (@la_naturalist) 's Twitter Profile Photo

Happy to share our new monograph on redlining, birds, their habitat, and people in Los Angeles just out in American Ornithological Society. Please see the infographic below, put together by KAP. Design, for details If you're unable to access the paper (see link) please DM me academic.oup.com/condor/advance…

Happy to share our new monograph on redlining, birds, their habitat, and people in Los Angeles just out in <a href="/AmOrnith/">American Ornithological Society</a>. Please see the infographic below, put together by <a href="/KAPdesign/">KAP. Design</a>, for details  

If you're unable to access the paper (see link) please DM me

academic.oup.com/condor/advance…
KAP. Design (@kapdesign) 's Twitter Profile Photo

A new infographic collaboration with Eric M. Wood about research into the effects of redlining on birds, their habitat, and people in Los Angeles. #scicomm #visualabstract #ornithology
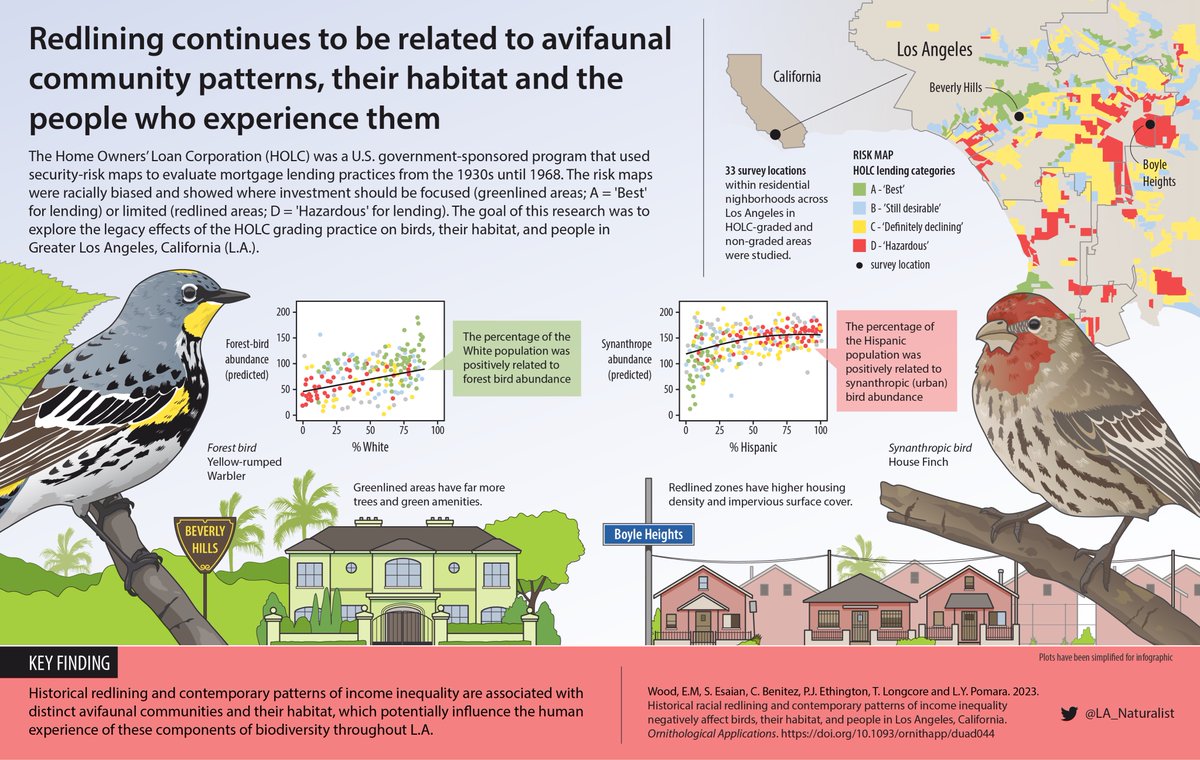
A new infographic collaboration with <a href="/LA_Naturalist/">Eric M. Wood</a> about research into the effects of redlining on birds, their habitat, and people in Los Angeles. #scicomm #visualabstract #ornithology
KAP. Design (@kapdesign) 's Twitter Profile Photo

We've collaborated with Intact Centre | Centre Intact to create this infographic sheet about flood-resilient measures that can reduce damage from extreme rainfall events in commercial real estate. See all of the climate-ready infographics at intactcentreclimateadaptation.ca/climate-ready-… #infographics
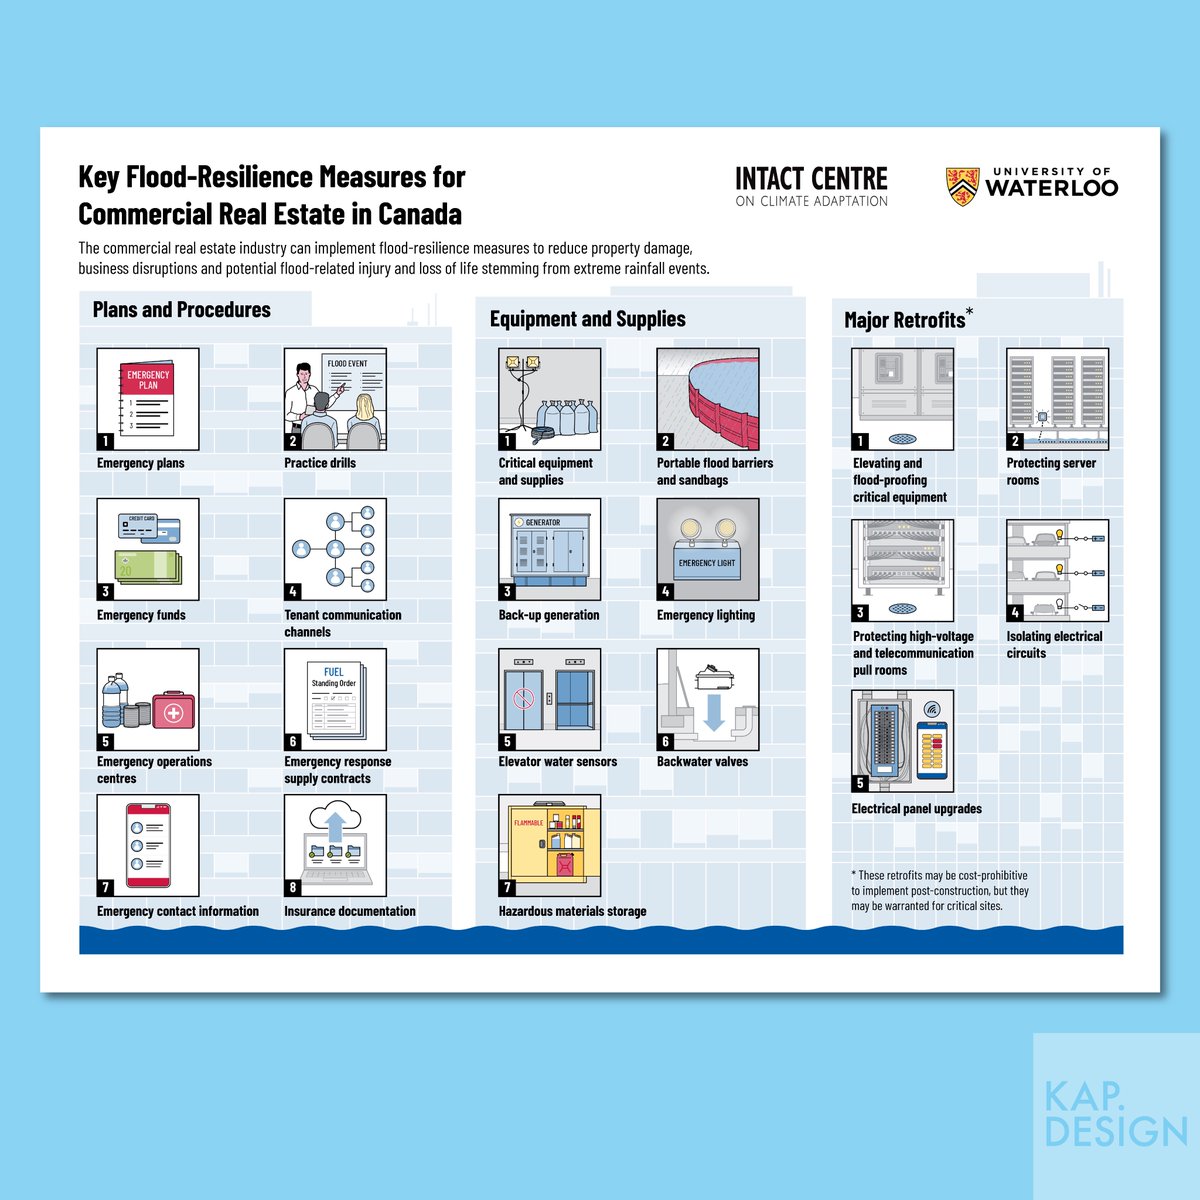
We've collaborated with <a href="/ICCA_Canada/">Intact Centre | Centre Intact</a> to create this infographic sheet about flood-resilient measures that can reduce damage from extreme rainfall events in commercial real estate. See all of the climate-ready infographics at intactcentreclimateadaptation.ca/climate-ready-… #infographics
KAP. Design (@kapdesign) 's Twitter Profile Photo

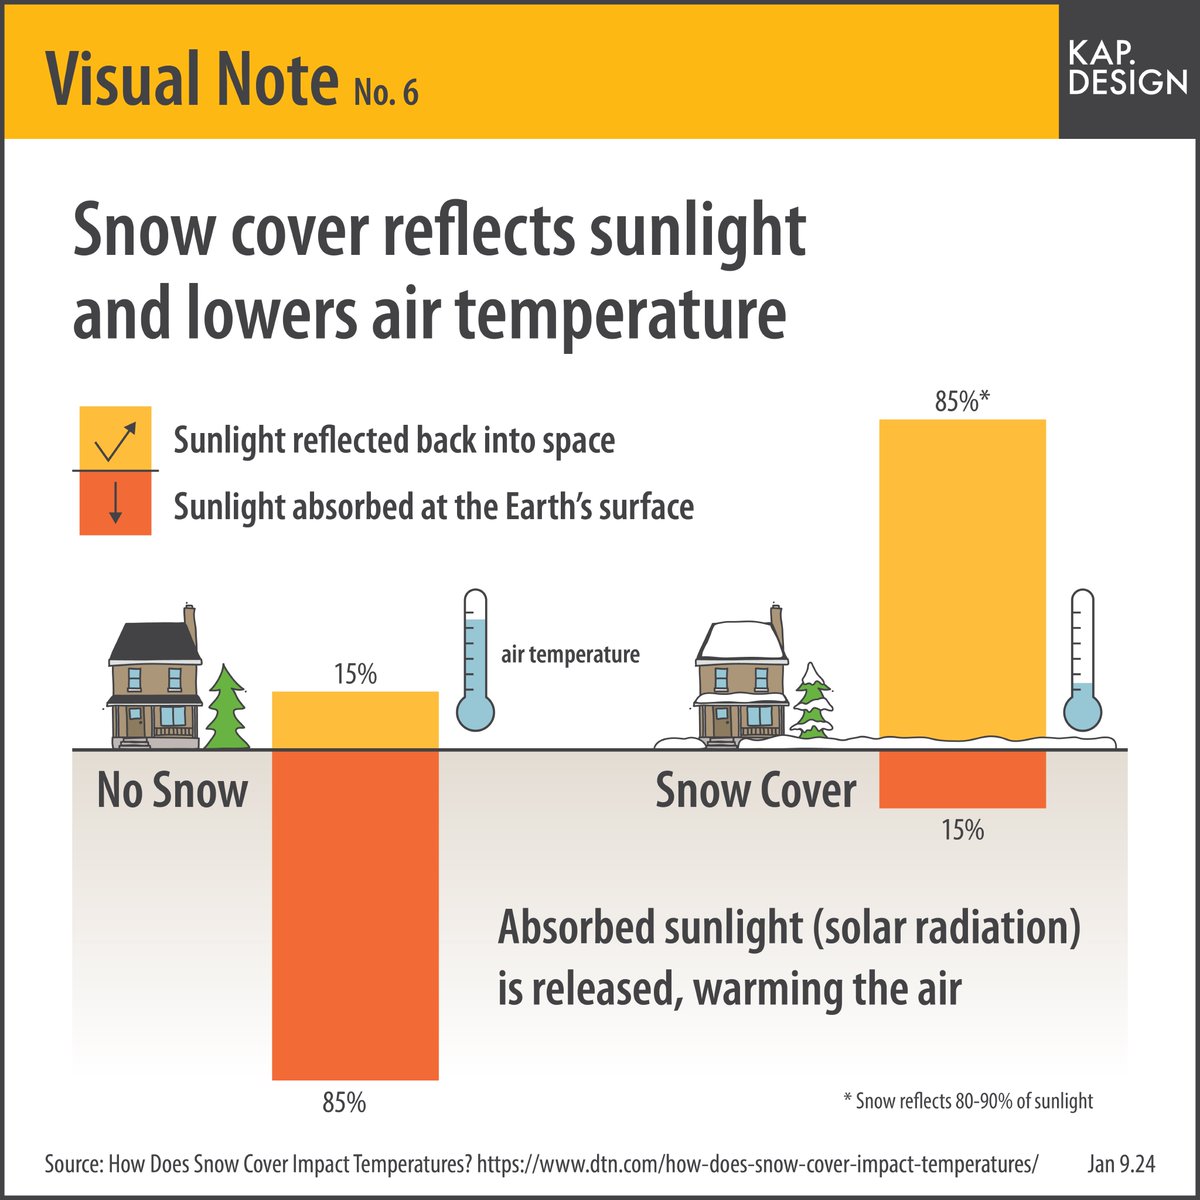
Visual Note 6. Did you know that snow cover impacts air temperature? Visual Notes is a series of infographics created by KAP to visualize interesting information discovered during the day-to-day rigmarole. #infographic

Visual Note 6. Did you know that snow cover impacts air temperature? Visual Notes is a series of infographics created by KAP to visualize interesting information discovered during the day-to-day rigmarole. #infographic
KAP. Design (@kapdesign) 's Twitter Profile Photo

Visual Note 7. Three bird populations in Canada have significantly declined since 1970. Visual Notes is a series of infographics created by KAP to visualize information discovered during the day-to-day rigmarole. #infographic

Visual Note 7. Three bird populations in Canada have significantly declined since 1970.  Visual Notes is a series of infographics created by KAP to visualize information discovered during the day-to-day rigmarole. #infographic