Jan Broder Engler (@janbroderengler) 's Twitter Profile
Jan Broder Engler

@janbroderengler

Scientist and software developer. Creator of tidyplots.org.

ID: 703635917131665408

linkhttps://jbengler.de calendar_today27-02-2016 17:40:50

414 Tweet

2,2K Followers

822 Following

Jan Broder Engler (@janbroderengler) 's Twitter Profile Photo

This how you can use plotmath expressions for special characters in #tidyplots 🔥 Just surround your string by "$" characters. Plotmath syntax: stat.ethz.ch/R-manual/R-dev… #rstats #dataviz #phd

This how you can use plotmath expressions for special characters in #tidyplots 🔥

Just surround your string by "$" characters.

Plotmath syntax: stat.ethz.ch/R-manual/R-dev…

#rstats #dataviz #phd
Jan Broder Engler (@janbroderengler) 's Twitter Profile Photo

Too many vector shapes can slow down PDF performance. This is how you can selectively rasterize data points in #tidyplots 🪩 In this example, I used 100 DPI for demonstration purposes. In practice, you would typically use 300 DPI for better quality 😉 #rstats #dataviz #phd

Too many vector shapes can slow down PDF performance. This is how you can selectively rasterize data points in #tidyplots 🪩

In this example, I used 100 DPI for demonstration purposes. In practice, you would typically use 300 DPI for better quality 😉

#rstats #dataviz #phd
Jan Broder Engler (@janbroderengler) 's Twitter Profile Photo

When you execute a #tidyplots color scheme like `colors_continuous_viridis` in the Console, you will get a preview in the RStudio Viewer pane 🌈 Pro tip: You can highlight and copy individual hex codes directly from the Viewer pane. #rstats #dataviz #phd

When you execute a #tidyplots color scheme like `colors_continuous_viridis` in the Console, you will get a preview in the RStudio Viewer pane 🌈

Pro tip: You can highlight and copy individual hex codes directly from the Viewer pane.

#rstats #dataviz #phd
Jan Broder Engler (@janbroderengler) 's Twitter Profile Photo

This is the anatomy of #tidyplots 🩻 They come in 50 x 50 mm, but can be resized to your linking using `adjust_size()` 😉 #rstats #dataviz #phd

This is the anatomy of #tidyplots 🩻

They come in 50 x 50 mm, but can be resized to your linking using `adjust_size()` 😉

#rstats #dataviz #phd
Esraa A. Gabal (@e_gabal) 's Twitter Profile Photo

I love everything about tidyplots 🤣😅 It was a burden for me having figures with good resolution and readable info ... this package is just a miracle to advance visualization in R Jan Broder Engler

Jan Broder Engler (@janbroderengler) 's Twitter Profile Photo

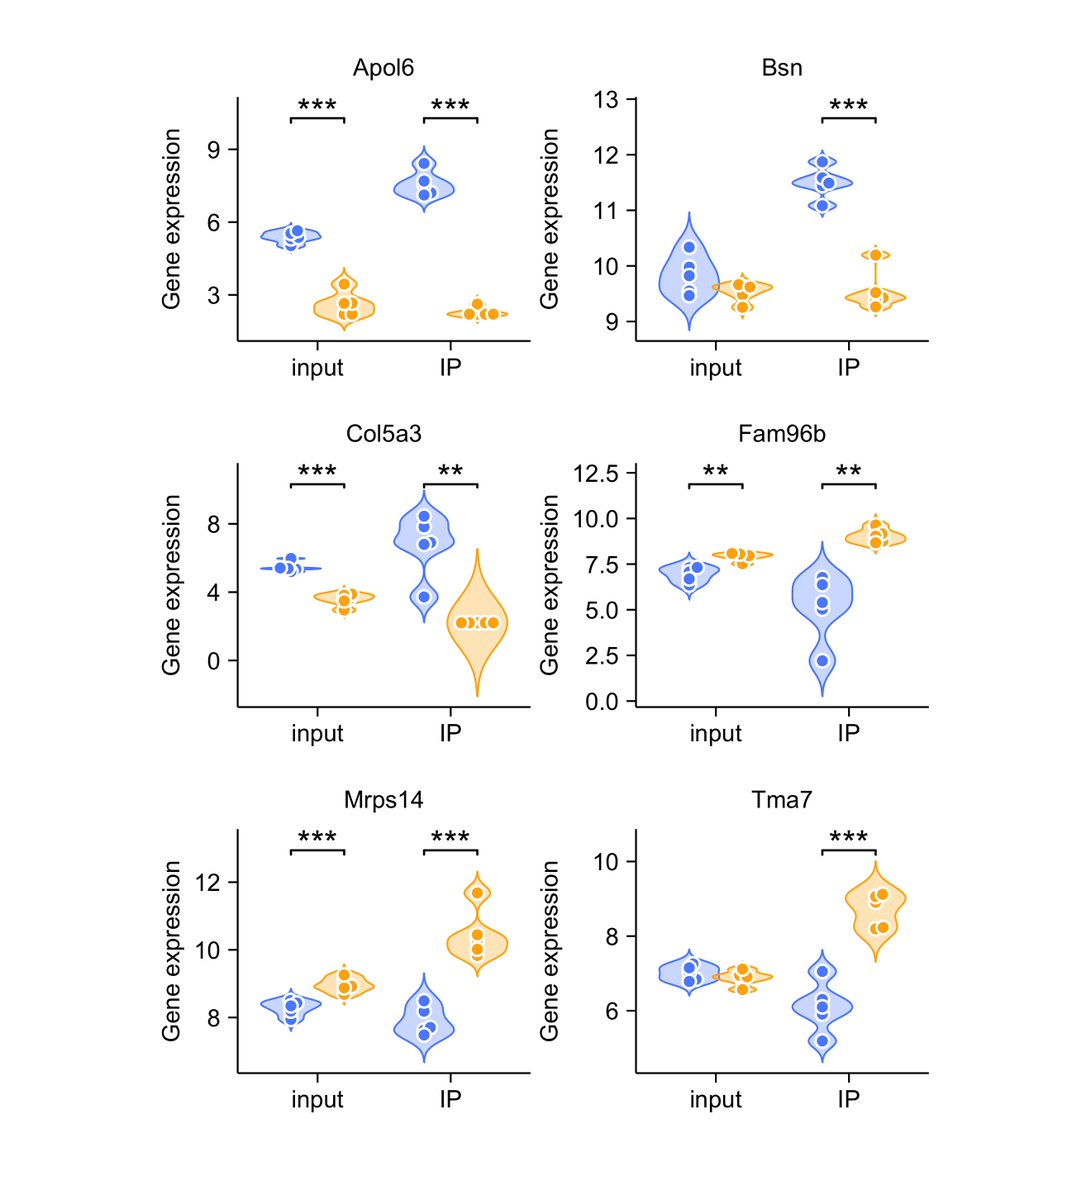
Intriguing study in Cell by Marcel Seungsu Woo et al. using #tidyplots 🚀 doi.org/10.1016/j.cell… A story of how neurons manage protein housekeeping — until inflammation hijacks the system. #rstats #dataviz #phd

Intriguing study in Cell by <a href="/woo_marcel/">Marcel Seungsu Woo</a> et al. using #tidyplots 🚀

doi.org/10.1016/j.cell…

A story of how neurons manage protein housekeeping — until inflammation hijacks the system.

#rstats #dataviz #phd
Marcel Seungsu Woo (@woo_marcel) 's Twitter Profile Photo

How does 🧠🔥 leads to proteasomal dysfunction? Check out our new study in Cell Press where we discovered how the immunoproteasome disturbs the neuronal ⚖️ INIMS UKE Hamburg authors.elsevier.com/sd/article/S00…