Jack Milne(@JackMilnePDSNet) 's Twitter Profileg
Jack Milne

@JackMilnePDSNet

Investment teacher for https://t.co/Soc0nLHzrE, Jack has been helping ordinary people to choose the right shares and time their transactions on the JSE for 40 years.

ID:1447585407504424960

calendar_today11-10-2021 15:31:41

187 Tweets

53 Followers

0 Following

Jack Milne(@JackMilnePDSNet) 's Twitter Profile Photo

Now that the has broken strongly above its previous record high, the 6-week correction is over and we can expect it to move up strongly. How far will it go? In our tweet of 25-1-24 we said our calculations showed that it would reach 6458 sometime in the next 2 years.

account_circle
Jack Milne(@JackMilnePDSNet) 's Twitter Profile Photo

On Friday, the closed about half a percent below its record close of 5254. This almost certainly means that it will break to a new record high soon. There is an outside possibility of a 'double top' forming, but the excessive optimism in the market now makes that unlikely.

On Friday, the #SP500 closed about half a percent below its record close of 5254. This almost certainly means that it will break to a new record high soon. There is an outside possibility of a 'double top' forming, but the excessive optimism in the market now makes that unlikely.
account_circle
Jack Milne(@JackMilnePDSNet) 's Twitter Profile Photo

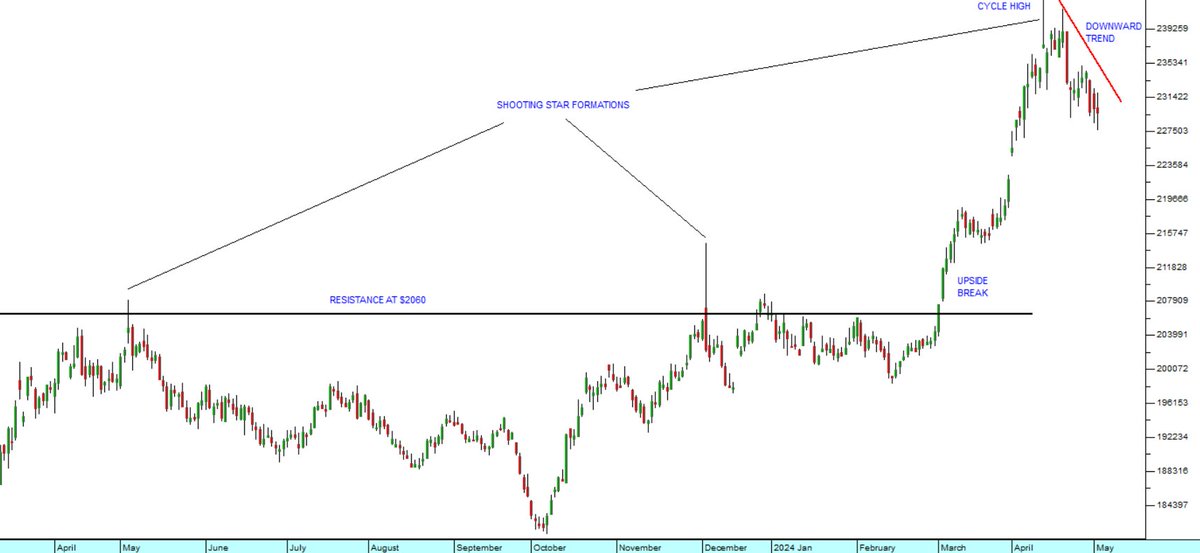
On 15th April we drew attention to the fact that cycle highs in the price of were inevitably marked by a 'shooting star' candle - and that on Friday 12th April the shooting star in gold suggested that the metal's price would begin a downward trend. That is now happening.

On 15th April we drew attention to the fact that cycle highs in the price of #gold were inevitably marked by a 'shooting star' candle - and that on Friday 12th April the shooting star in gold suggested that the metal's price would begin a downward trend. That is now happening.
account_circle
Jack Milne(@JackMilnePDSNet) 's Twitter Profile Photo

As predicted in my article (below) the opened up 0,5%. Then it quickly fell back to just above yesterday's close. It has now rallied again and looks to be forming a convincing 'hammer' formation - which is very bullish, at least in the short-term. We expect further upside.

account_circle
Jack Milne(@JackMilnePDSNet) 's Twitter Profile Photo

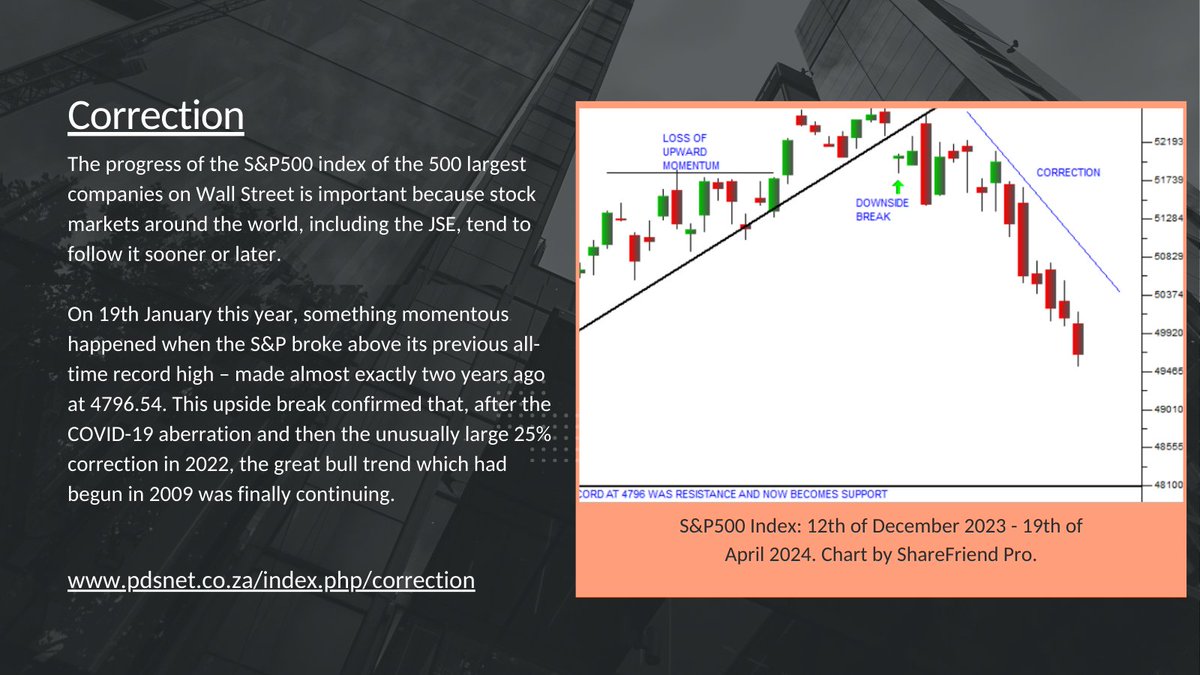
I've just published a new article on PDSNet website discussing the recent developments in the S&P500 index and its implications for global markets.
pdsnet.co.za/index.php/corr…

I've just published a new article on PDSNet website discussing the recent developments in the S&P500 index and its implications for global markets. #SP500 #StockMarket #BullMarket #MarketTrends #FinancialNews #MarketCorrection pdsnet.co.za/index.php/corr…
account_circle
Jack Milne(@JackMilnePDSNet) 's Twitter Profile Photo

The expected correction is well under way in the . It is now down 4,4% on its record high of 5254 made on 28-3-24. We expect that it will end up falling close to resistance at the previous record high of 4796. In other words, the correction will take it down 8,7% in the end

account_circle
Jack Milne(@JackMilnePDSNet) 's Twitter Profile Photo

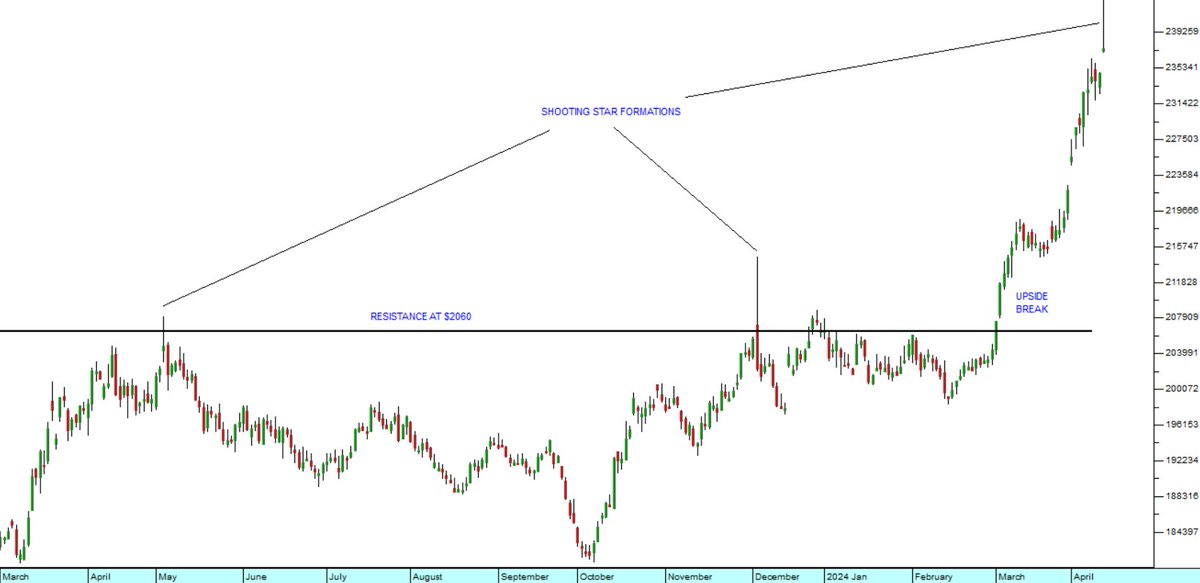
This chart shows the US$ price of since March 2024. Note the 'shooting star' formations which occurred at the last two cyclical peaks on 4-5-23 and 1-12-23. Yesterday, a similar formation indicated that the upward surge in gold may have peaked - at least in the short term.

This chart shows the US$ price of #gold since March 2024. Note the 'shooting star' formations which occurred at the last two cyclical peaks on 4-5-23 and 1-12-23. Yesterday, a similar formation indicated that the upward surge in gold may have peaked - at least in the short term.
account_circle
Jack Milne(@JackMilnePDSNet) 's Twitter Profile Photo

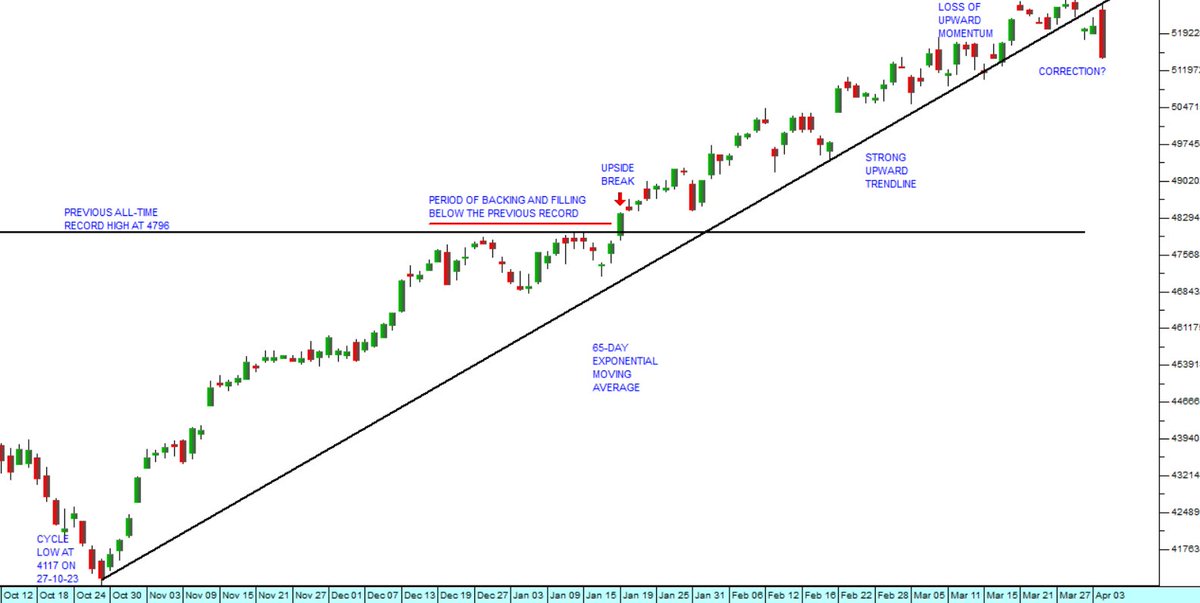
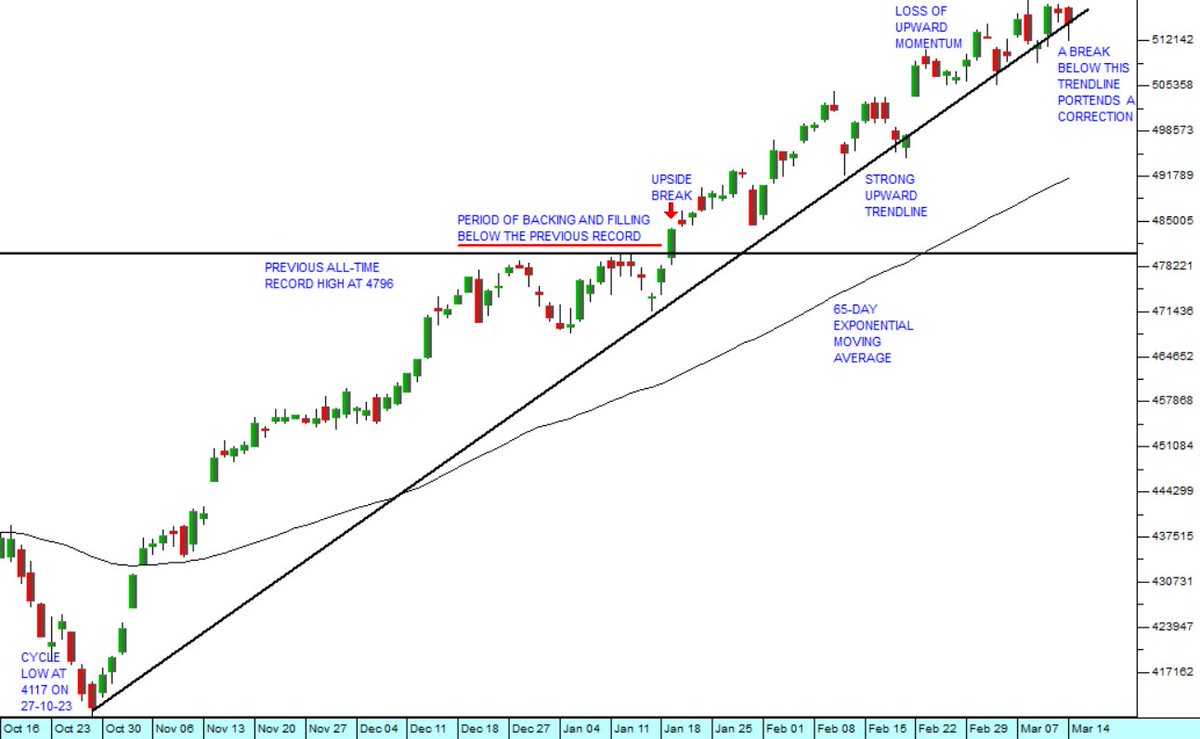
The loss of upward momentum in the became obvious last night with its 1,23% drop. There is less and less confidence in that the first decline in interest rates will come in June. The correction, if this is it, is long overdue. We see it as being quite severe.

The loss of upward momentum in the #SP500 became obvious last night with its 1,23% drop. There is less and less confidence in that the first decline in interest rates will come in June. The correction, if this is it, is long overdue. We see it as being quite severe.
account_circle
Jack Milne(@JackMilnePDSNet) 's Twitter Profile Photo

The area above 5100 on the does not appear to be sustainable and, as indicated earlier, a correction looks imminent. The 'backing and filling' above this level signifies a loss of upward momentum. The market now fears that the will delay reducing rates beyond June.

The area above 5100 on the #SP500 does not appear to be sustainable and, as indicated earlier, a correction looks imminent. The 'backing and filling' above this level signifies a loss of upward momentum. The market now fears that the #Fed will delay reducing rates beyond June.
account_circle
Jack Milne(@JackMilnePDSNet) 's Twitter Profile Photo

Forward P:Es on the 'Magnificent 7' tech stocks on are around 30 - which is very high. A correction is overdue and Nvidia's over-discounted impending results give you the recipe for a downward move. As previously indicated, the should retrace to support at 4796

account_circle
Jack Milne(@JackMilnePDSNet) 's Twitter Profile Photo

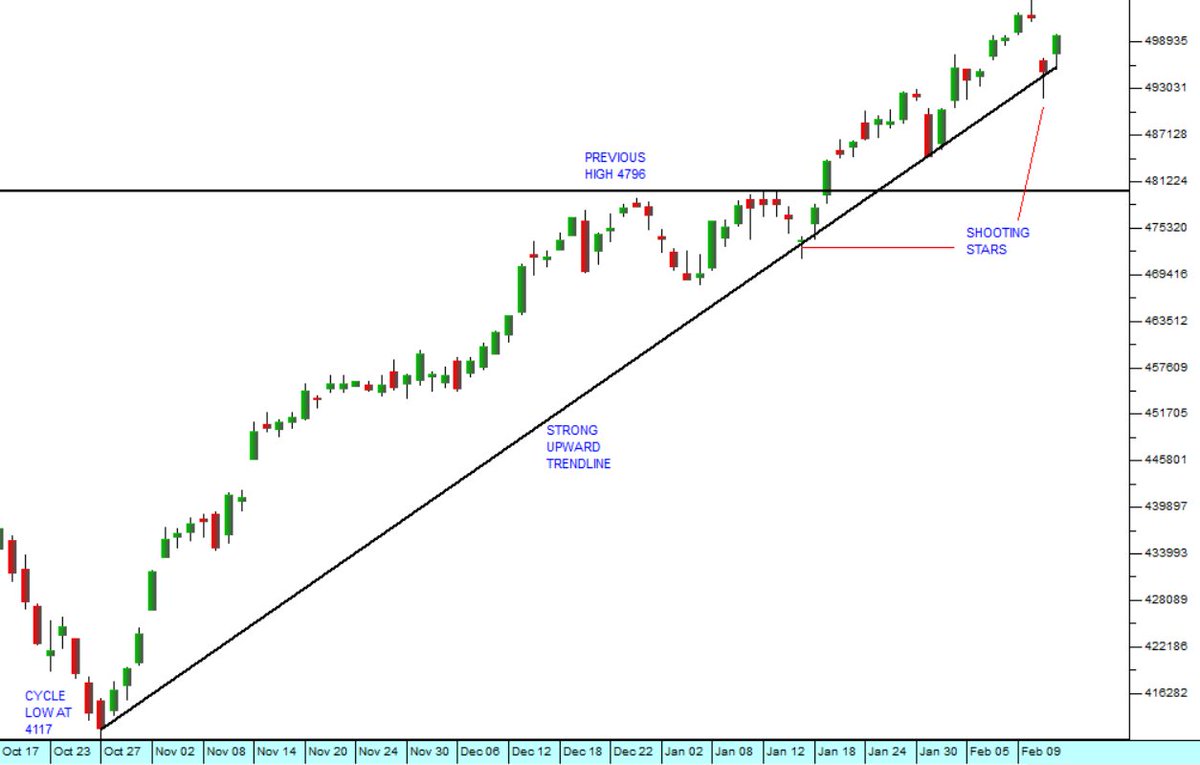
The strength of the upward trend on the indicates excessive bullishness. Note the 'shooting stars' at the bottom of the cycles showing that the bulls are again 'buying the dips' with abandon. In our view, this upward momentum cannot be sustained.

The strength of the upward trend on the #SP500 indicates excessive bullishness. Note the 'shooting stars' at the bottom of the cycles showing that the bulls are again 'buying the dips' with abandon. In our view, this upward momentum cannot be sustained.
account_circle
Jack Milne(@JackMilnePDSNet) 's Twitter Profile Photo

Now that the has broken above 5000 the market is being driven more by euphoria than intelligence. The smart money is selling out into the strength. This can be seen in the recent weakness of the . Risk-off sentiment should now take the S&P back to support at 4796.

account_circle
Jack Milne(@JackMilnePDSNet) 's Twitter Profile Photo

The 1,6% drop in the yesterday indicates that the correction which we predicted in 23rd January is now under way. The index should bounce off support at 4796 in the short term - and then continue upwards after that.

account_circle
Jack Milne(@JackMilnePDSNet) 's Twitter Profile Photo

The price just keeps on climbing - which is good for and bad for , especially in an election year. We reiterate that some kind of correction on the is imminent. The is still in a downward trend which indicates that 'risk-off' sentiment is growing.

account_circle
Jack Milne(@JackMilnePDSNet) 's Twitter Profile Photo

So now that we are breaking new record highs on the almost every day, it is fitting to ask how high it will go. Our calculations indicate that will reach 6458 some time in the next two years. The upward trend will certainly be broken by corrections.

account_circle
Jack Milne(@JackMilnePDSNet) 's Twitter Profile Photo

It is now reasonable to expect that the will correct back towards the previous high at 4796. What was a resistance level before should then act as a support level. The weakness in the since 16th Jan suggests that a shift towards 'risk-off' is in progress.

account_circle
Jack Milne(@JackMilnePDSNet) 's Twitter Profile Photo

As expected, the has broken up to a new intra-day record high. We expect the upward trend to gain momentum now, especially if the index can close above the previous record of 4796.56 on successive days. The JSE will follow - despite the negative prospects for the economy.

account_circle