Indonesisches Bergwiesel(@IBergwiesel) 's Twitter Profileg
Indonesisches Bergwiesel

@IBergwiesel

ID:1244718145874640896

calendar_today30-03-2020 20:09:14

35,4K Tweets

532 Followers

703 Following

Frederik Schenk(@FrederikSchenk) 's Twitter Profile Photo

In Roger Pielke Jr.'s book 'The Honest Broker' (2007) he discussed different roles a scientist can adopt when giving advice to policymakers. The concept was also heavily used to allow for different views regarding climate change.

In 2024, that honest broker is now for sale. 🤐

account_circle
Dr. Robert Rohde(@RARohde) 's Twitter Profile Photo

Sometimes, people try to argue that the global warming signal is an artifact of the bias adjustments & other quality control processes applied to weather station data.

That is easily shown to be untrue. The net effect of the adjustments on the global land average is very small.

Sometimes, people try to argue that the global warming signal is an artifact of the bias adjustments & other quality control processes applied to weather station data. That is easily shown to be untrue. The net effect of the adjustments on the global land average is very small.
account_circle
John Kennedy(@micefearboggis) 's Twitter Profile Photo

A mighty dataset 'Satellite-based time-series of sea-surface temperature since 1980 for climate applications'

nature.com/articles/s4159…

account_circle
Indonesisches Bergwiesel(@IBergwiesel) 's Twitter Profile Photo

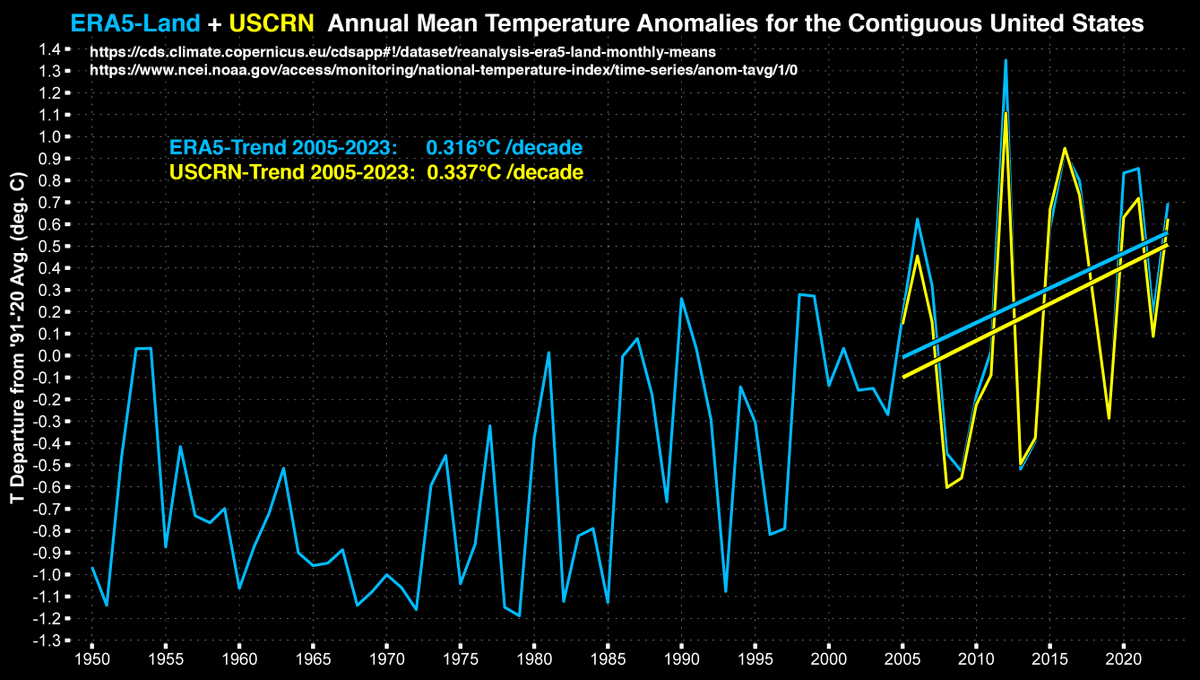
ERA5-Land annual mean temperature anomalies for the Contiguous US, relative to 1991 - 2020. I have added the USCRN record which - according to skeptics - shows no warming.

ERA5-Land annual mean temperature anomalies for the Contiguous US, relative to 1991 - 2020. I have added the USCRN record which - according to skeptics - shows no warming.
account_circle
Indonesisches Bergwiesel(@IBergwiesel) 's Twitter Profile Photo

ERSSTv5 North Atlantic sea surface temperature anomalies, but without the trend being artificially removed like in the AMO index.

ERSSTv5 North Atlantic sea surface temperature anomalies, but without the trend being artificially removed like in the AMO index.
account_circle
Lijing Cheng(@Lijing_Cheng) 's Twitter Profile Photo

[1/9] A holistic view of the Ocean heat content in 2023 is provided by looking at in situ, satellite data (CERES, and Geodetic: altimetry minus GRACE) and CMIP6 model simulations, now published in Nature Reviews Earth & Environment Nature Reviews Earth & Environment 🌈, doi.org/10.1038/s43017…

account_circle
Indonesisches Bergwiesel(@IBergwiesel) 's Twitter Profile Photo

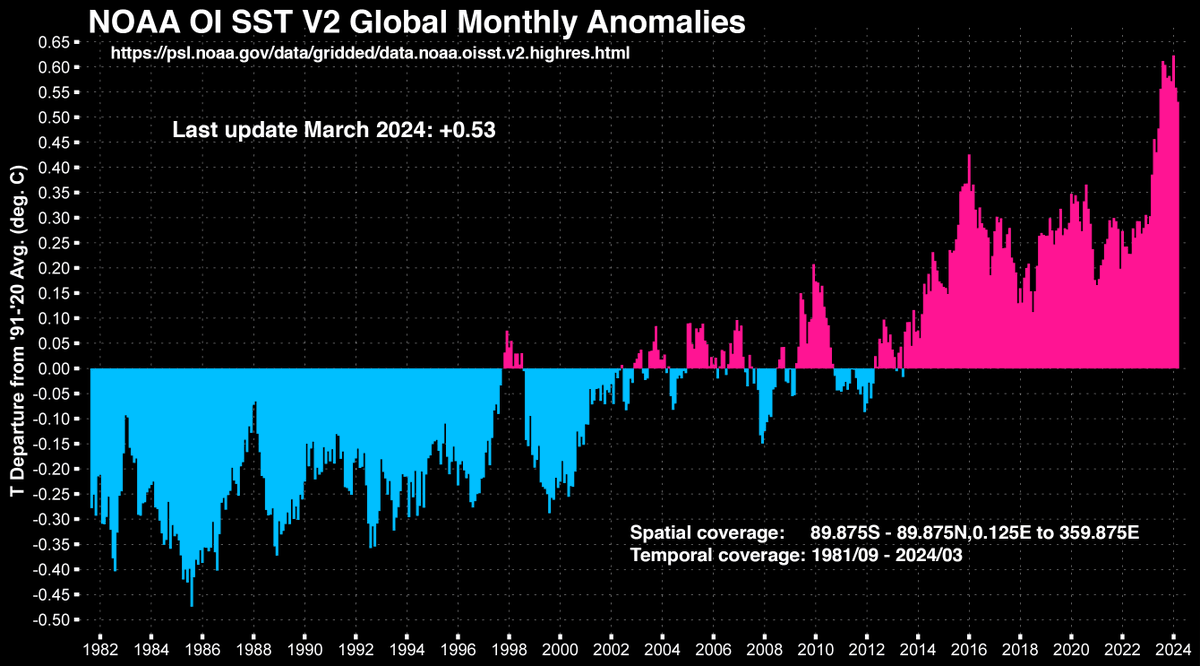
OISSTv2 global monthly anomalies updated to March 2024. March finished 0.53°C above the '91 - '20 baseline, putting it in 9th place.

OISSTv2 global monthly anomalies updated to March 2024. March finished 0.53°C above the '91 - '20 baseline, putting it in 9th place.
account_circle
Zeke Hausfather(@hausfath) 's Twitter Profile Photo

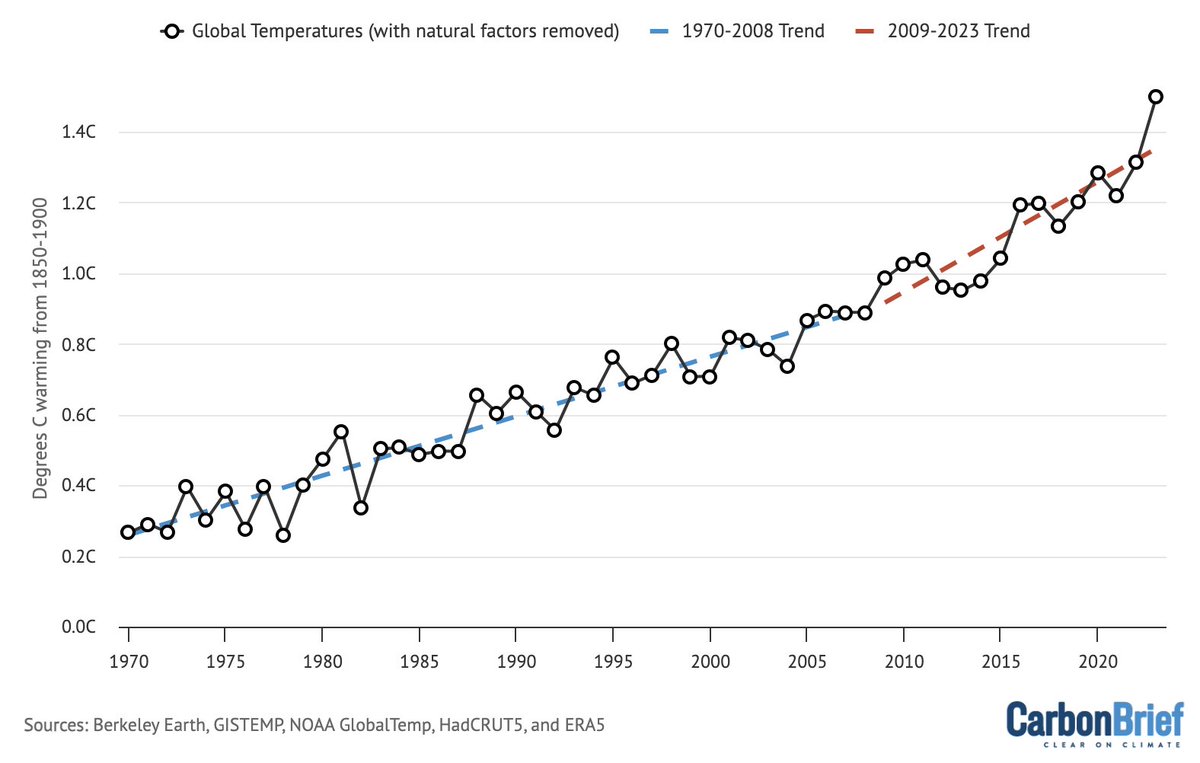
The rate of warming has increased notably over the past 15 years. This is not just natural variability – there is increasing evidence that the world is now warming faster than it has since 1970.

However, this should not come as a surprise; acceleration is exactly what our models…

The rate of warming has increased notably over the past 15 years. This is not just natural variability – there is increasing evidence that the world is now warming faster than it has since 1970. However, this should not come as a surprise; acceleration is exactly what our models…
account_circle
Gavin Schmidt(@ClimateOfGavin) 's Twitter Profile Photo

Nothing illustrates the vacuity of what passes for climate scepticism in the UK than Matt Ridley retweeting Toby Young who publishes a piece by Chris Morrison based on total bollocks.

Nothing illustrates the vacuity of what passes for climate scepticism in the UK than Matt Ridley retweeting Toby Young who publishes a piece by Chris Morrison based on total bollocks.
account_circle
DWD Klima und Umwelt(@DWD_klima) 's Twitter Profile Photo

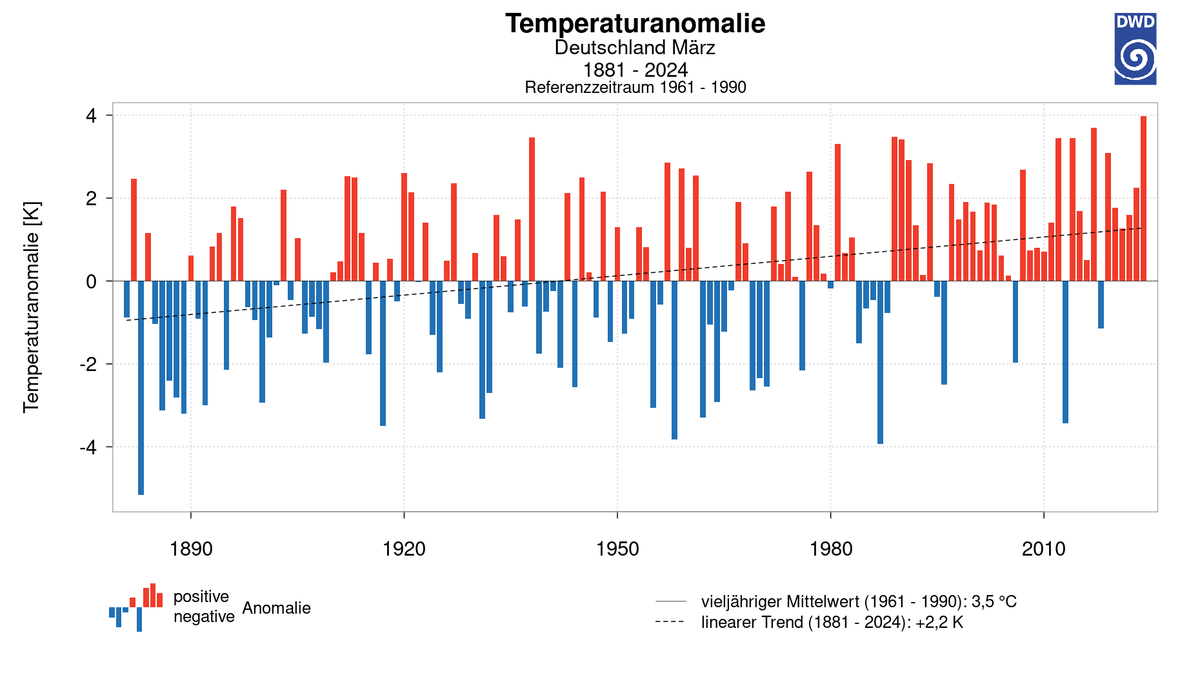
Mit einem Gebietsmittel von 7.5 °C war der März 2024 in Deutschland der wärmste März seit 1881 und 4 °C wärmer als die vieljährigen Märzmittel 1961-1990.

Mit einem Gebietsmittel von 7.5 °C war der März 2024 in Deutschland der wärmste März seit 1881 und 4 °C wärmer als die vieljährigen Märzmittel 1961-1990.
account_circle
Indonesisches Bergwiesel(@IBergwiesel) 's Twitter Profile Photo

This might be the worst possible way to present temperature data. ⤵️

twitter.com/1234Fit/status…

But luckily the experts at the Irish Meteorological Service provide us with a solid presentation.

met.ie/state-of-the-i…

This might be the worst possible way to present temperature data. ⤵️ twitter.com/1234Fit/status… But luckily the experts at the Irish Meteorological Service provide us with a solid presentation. met.ie/state-of-the-i…
account_circle
Indonesisches Bergwiesel(@IBergwiesel) 's Twitter Profile Photo

Sea level at Fort Denison, one of the most important climate series along with the lower troposphere temperature and GISP2.

Showing acceleration. 🤷‍♂️

account_circle
James Abbott(@JamesAbbott2013) 's Twitter Profile Photo

Presenting data in an appropriate and meaningful way - as in this plot - is taught at school in maths and science.
Or at least it was when I was there.
So how many AGW Deniers skipped maths and science ?

Presenting data in an appropriate and meaningful way - as in this plot - is taught at school in maths and science. Or at least it was when I was there. So how many AGW Deniers skipped maths and science ?
account_circle
Jim Java ꤶ @priscian@mastodon.social(@priscian) 's Twitter Profile Photo

Looks like Jim Steele is still at it, trying to save the ridiculous & already much-ridiculed 'Cold Truth' climate denial movie. He's blocked me, but as a rebuttal to this point—twitter.com/JimSteeleSkept…—feel free to use this tweet of mine x.com/priscian/statu…

account_circle
Jim Java ꤶ @priscian@mastodon.social(@priscian) 's Twitter Profile Photo

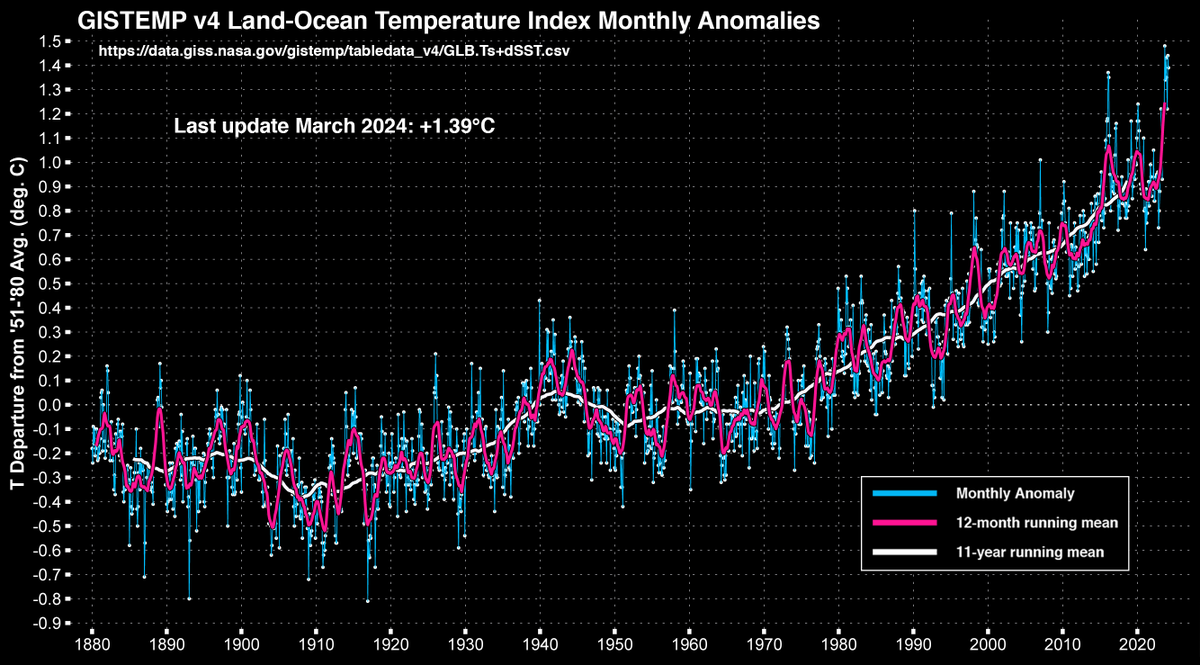
Jim Steele Maarten Keulemans The 1st figure is from Ljungqvist 2010 dx.doi.org/10.1111/j.1468…, ending in 2000. If we take its data (NH extratropical proxies) & plot it on the same baseline as a current land+SST series w/ the same coverage, we see that current temps are higher than L2010's MWP max (2nd figure).
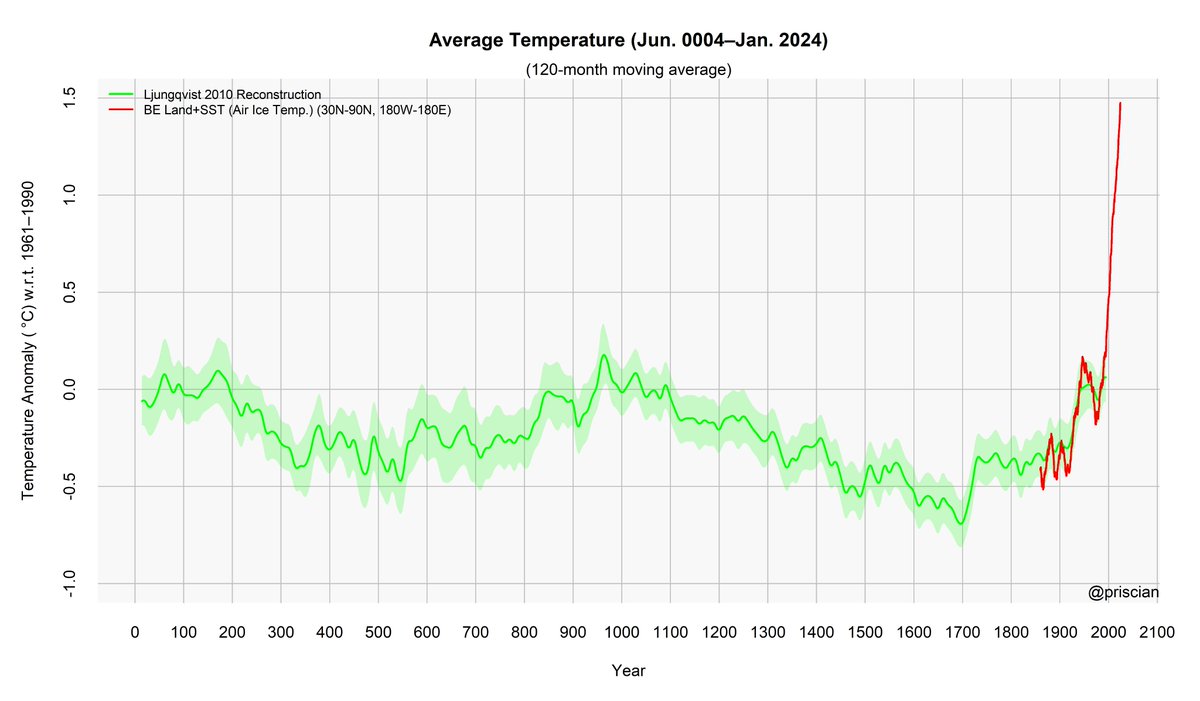
@JimSteeleSkepti @mkeulemans The 1st figure is from Ljungqvist 2010 dx.doi.org/10.1111/j.1468…, ending in 2000. If we take its data (NH extratropical proxies) & plot it on the same baseline as a current land+SST series w/ the same coverage, we see that current temps are higher than L2010's MWP max (2nd figure).
account_circle